Analyze Results
Lift Overview, Baseline Quality, and Lift Delta Analysis
Lift Calculation Options
7 days after your experiment begins, Gamesight will automatically begin calculating your results. If you had any market exclusions, or wanted your baseline calculated for a specific period of time, select Options in the top right:
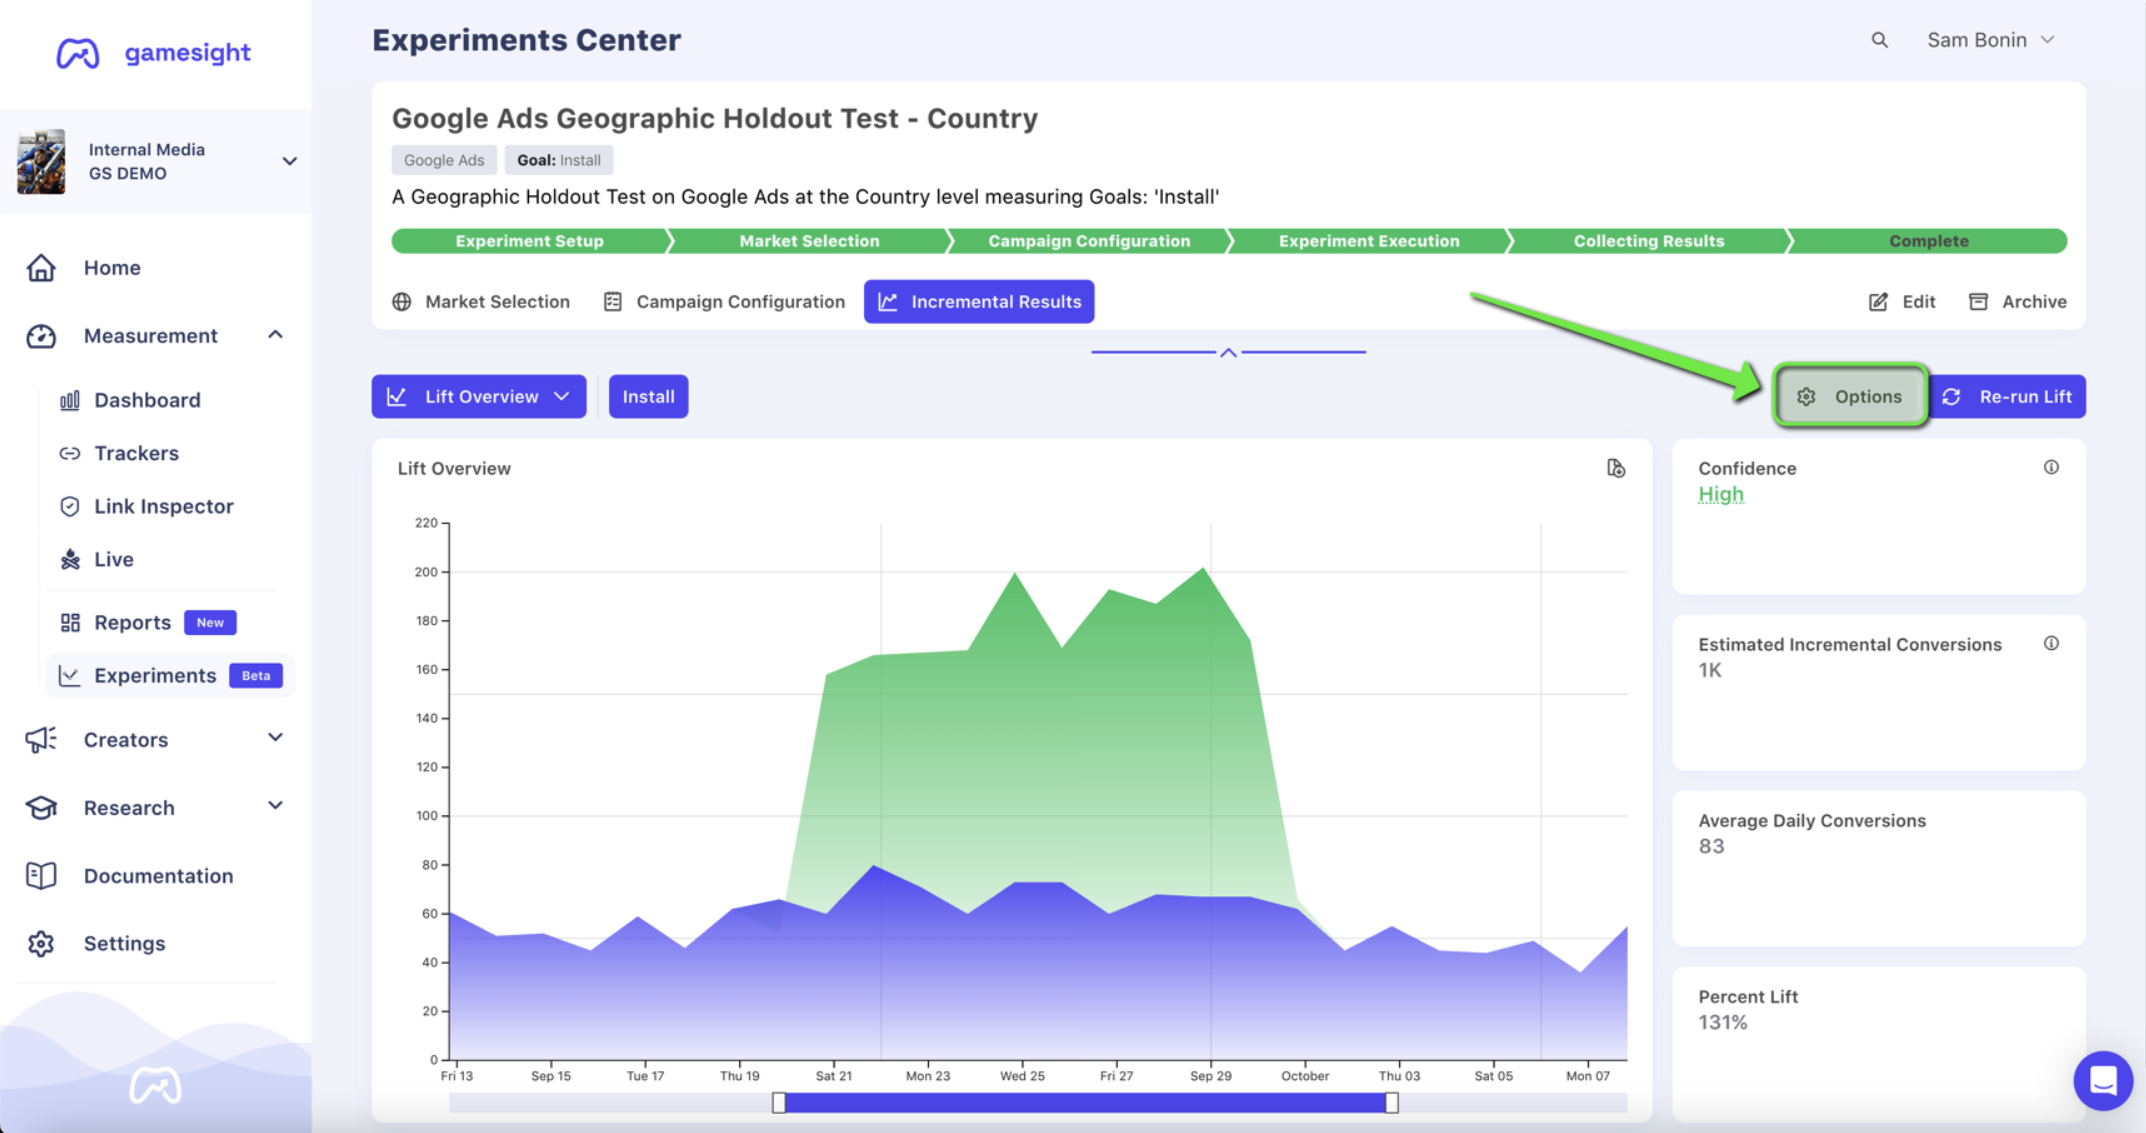
The following options are available:
- Baseline - input the specific time period to be used for your baseline calculation. This is useful if there have been historical campaigns in your target region, and you want to exclude these time periods from your baseline.
- Exclude Locations - be sure to input any regions you want excluded from your baseline calculation, as defined during Market Selection
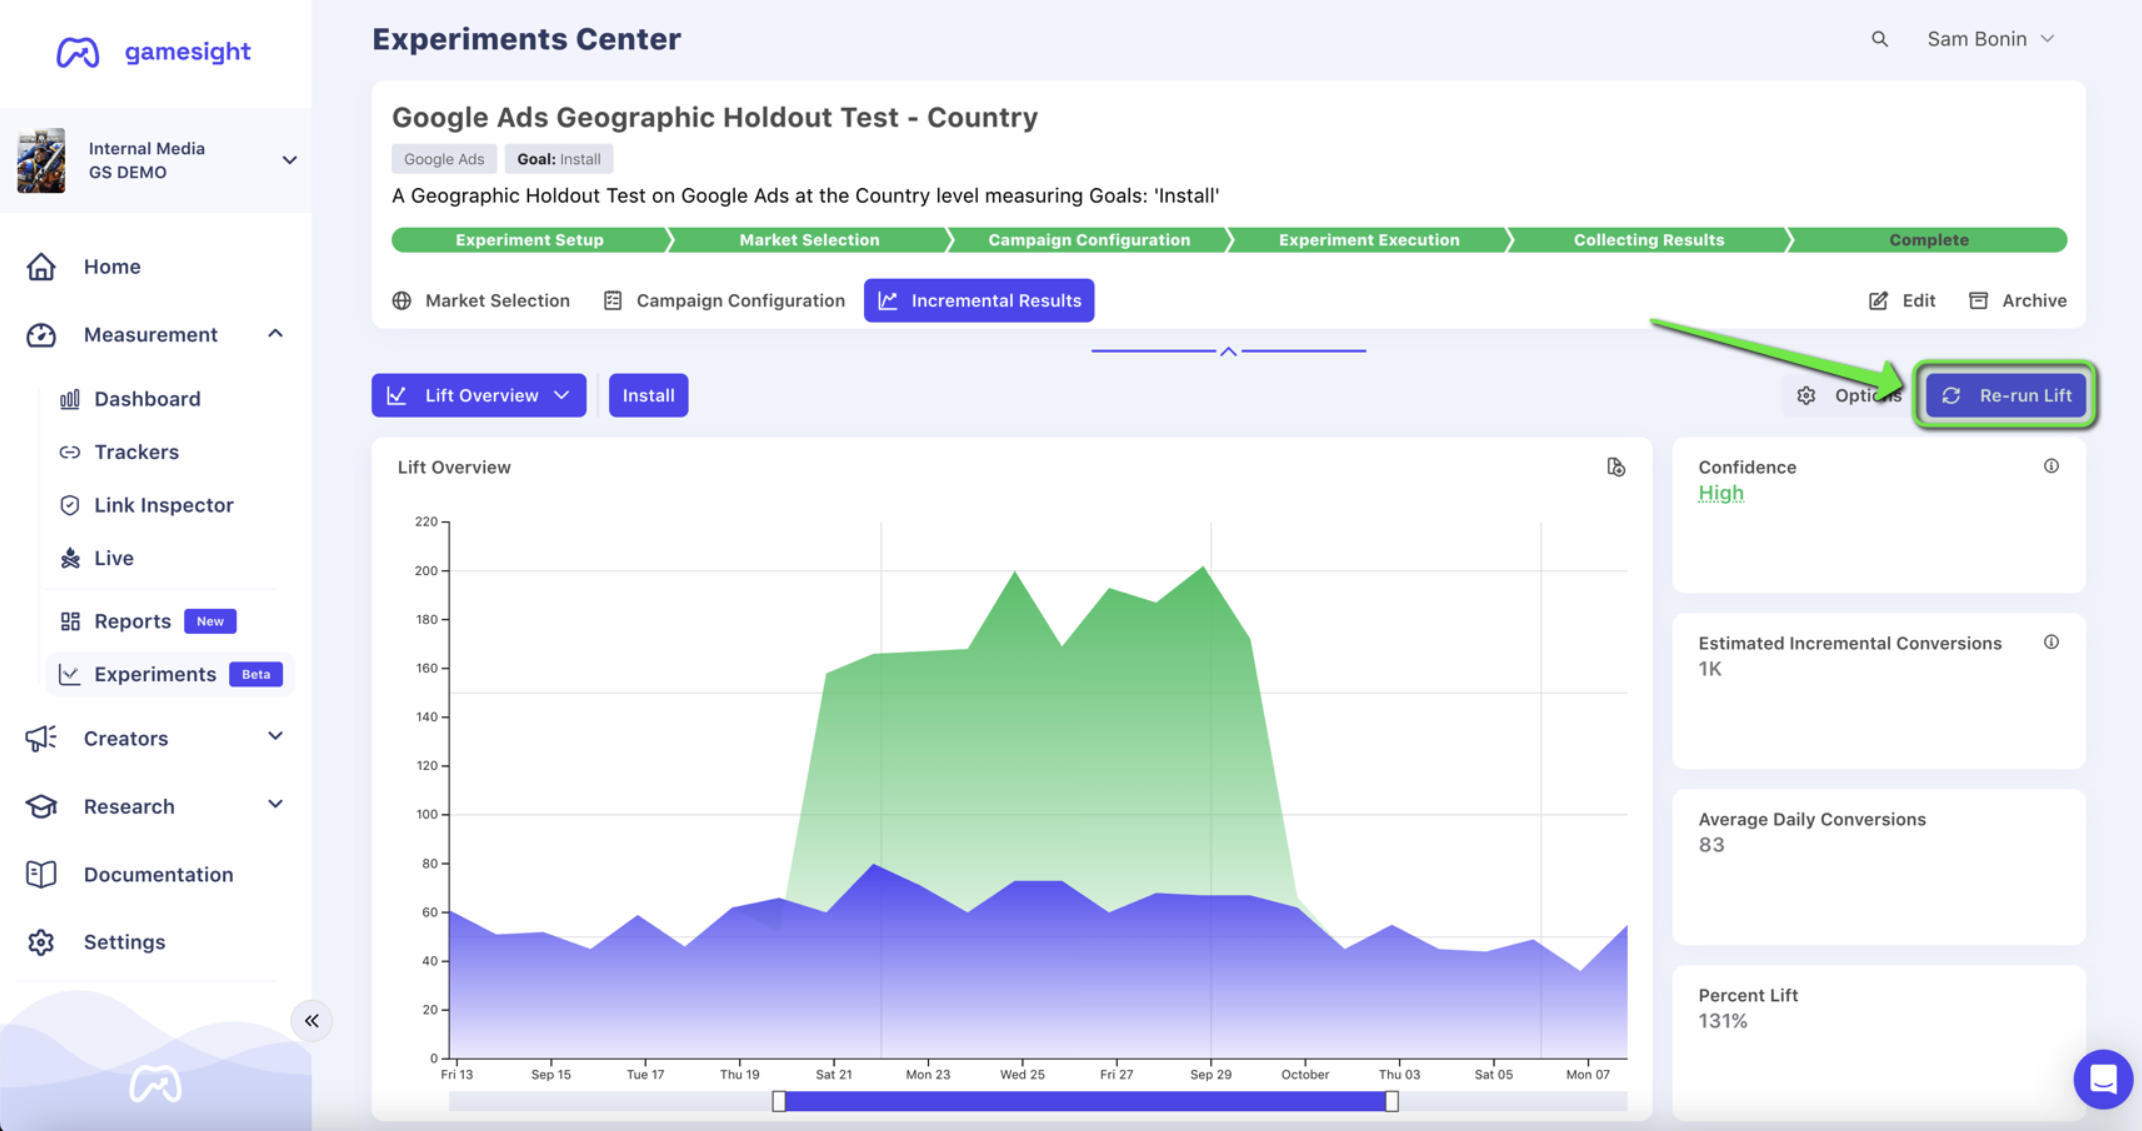
Once your selections have been made, select Save Options and then click Re-run Lift at the top right:
Model at Work!Lift calculations can take a while to compute. You may want to consider grabbing a snack after clicking Re-run Lift.
Once you're satisfied with your lift calculation parameters, it's time to analyze the results of your experiment.
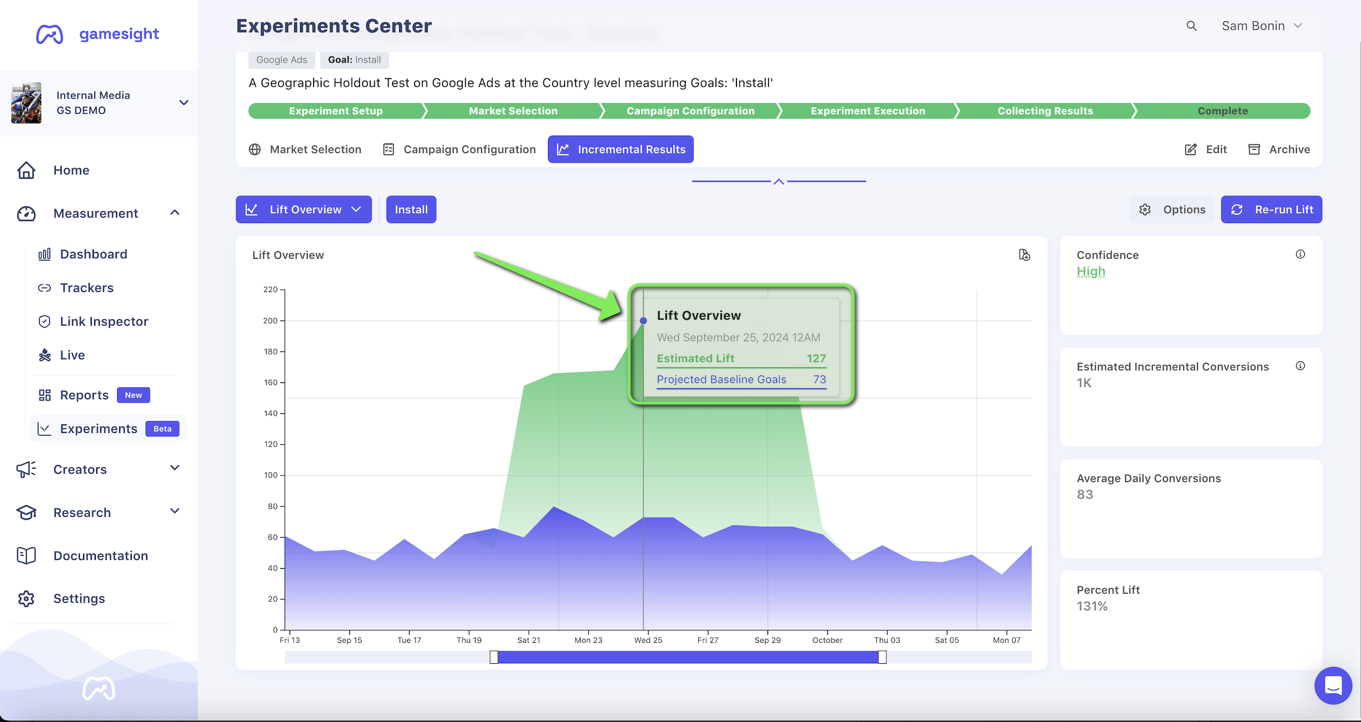
Lift Overview
The Lift Overview summarizes the results of your experiment in a simple-to-understand and easy-to-share format, with your test region conversions in green and your baseline conversions in purple. In a successful, experiment, your test region conversions will be greater than your baseline control. After your experiment concludes and your marketing spend is turned off, the test region results will generally look more like your purple control over time.
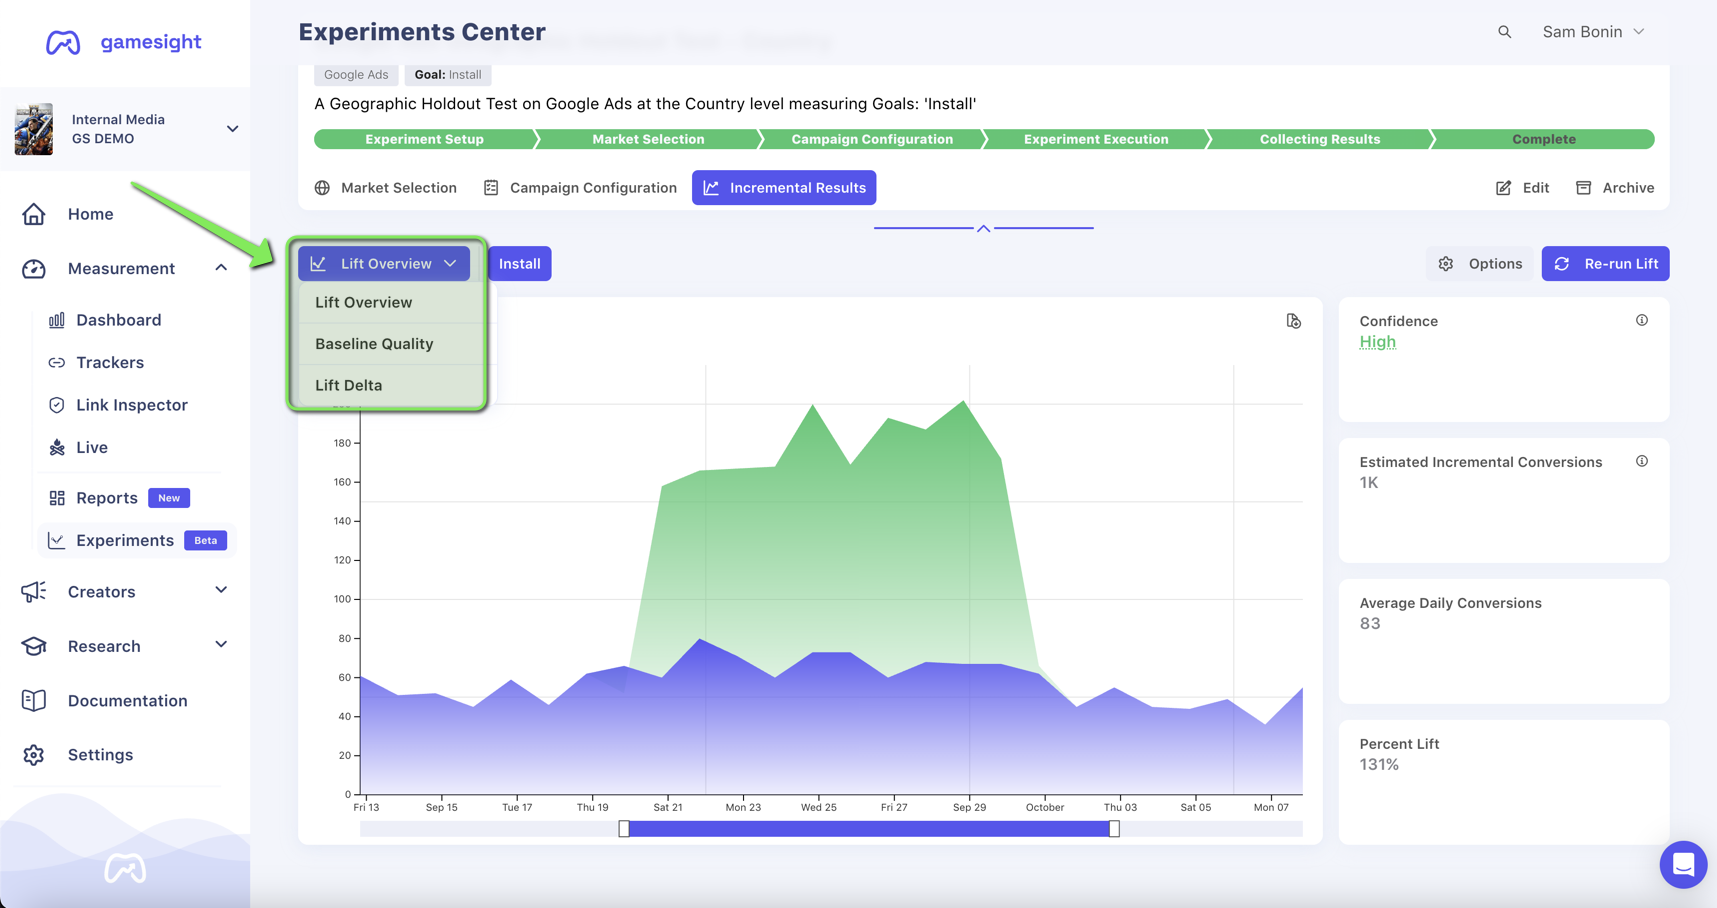
If you see a different visualization, and want to return to the Lift Overview, simply select Lift Overview from the dropdown at the top left:
On the right side of you're screen, you'll find four widgets summarizing the results of your experiment:
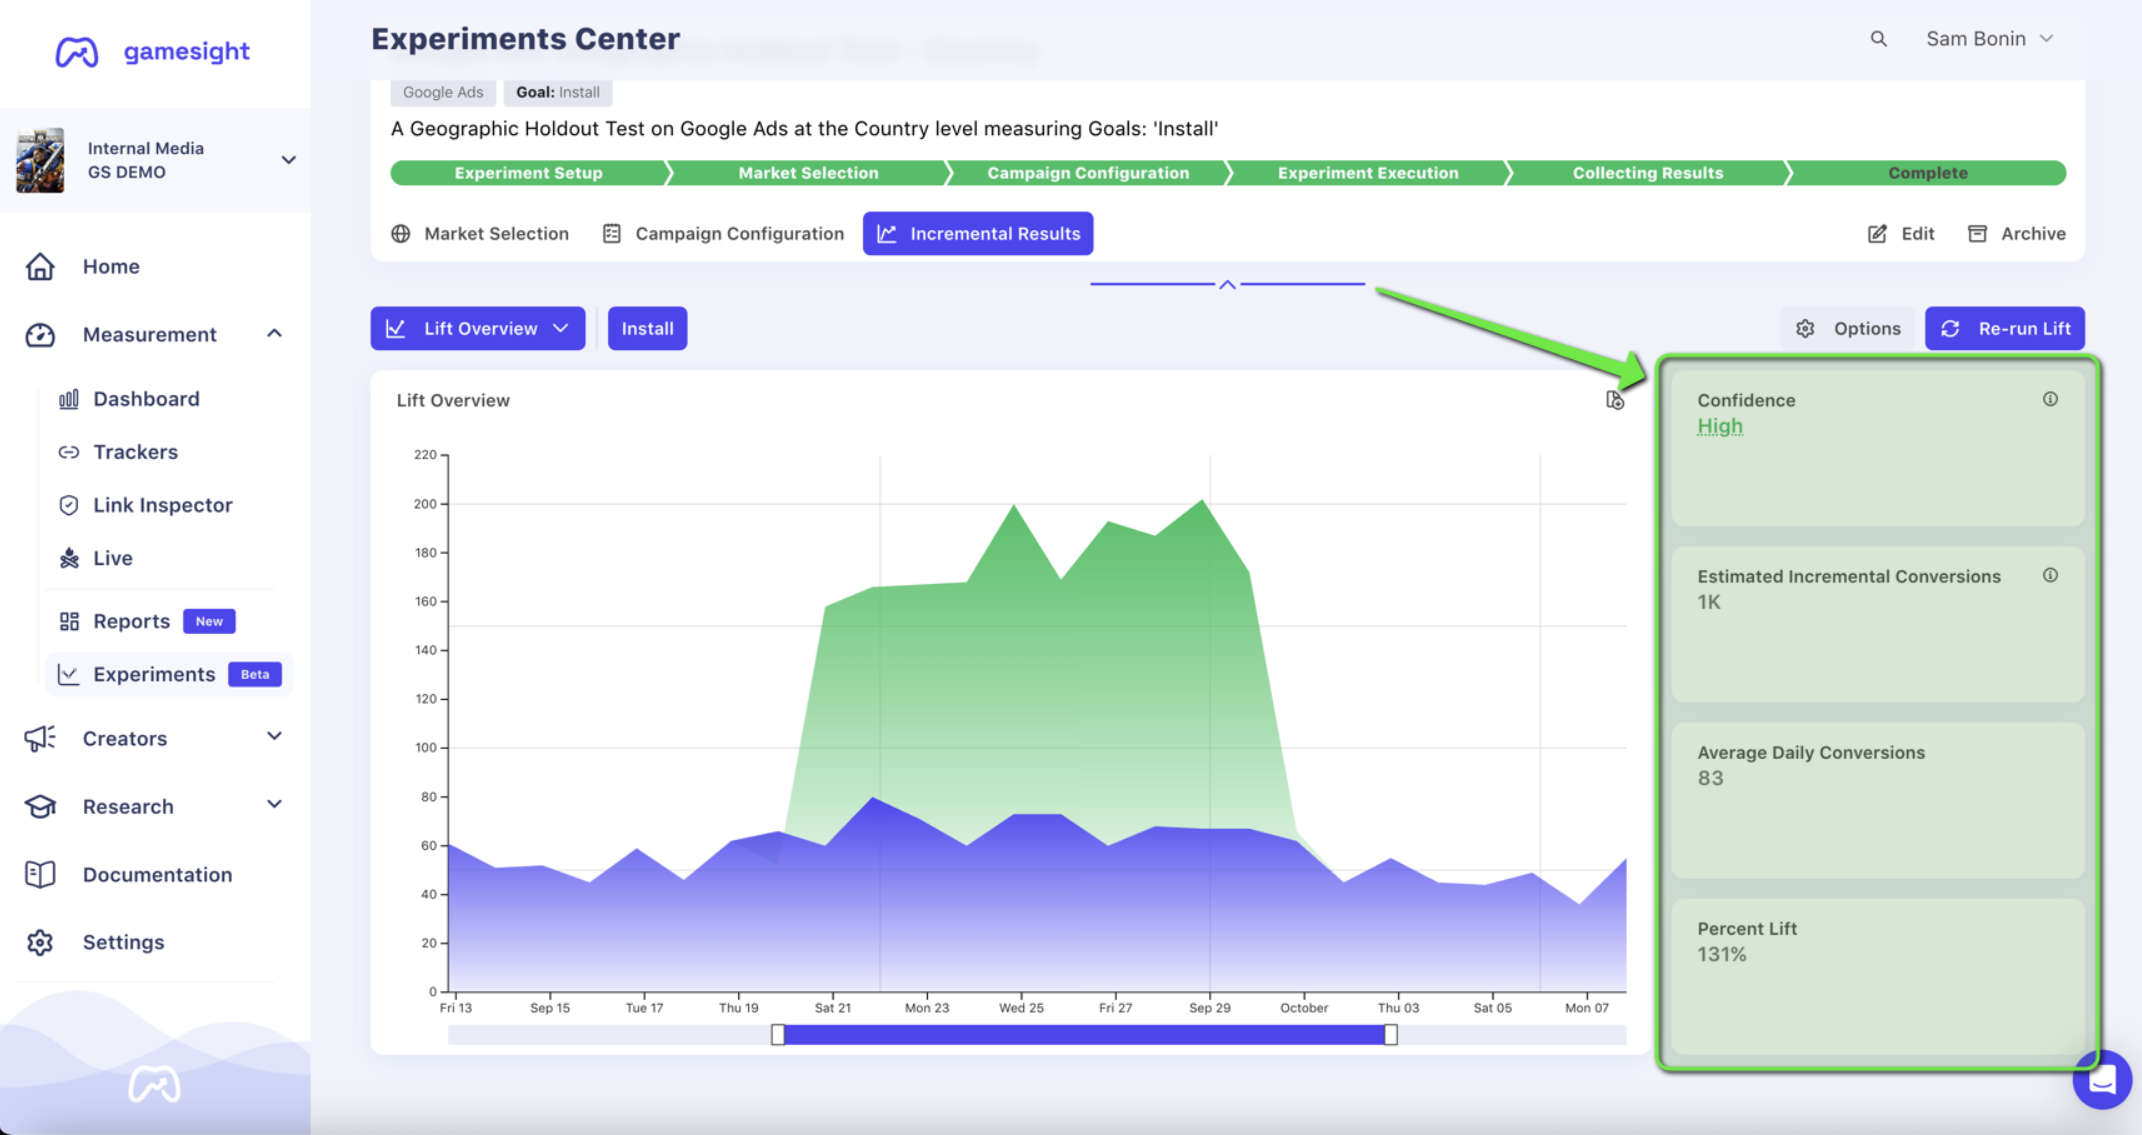
- Confidence - our confidence in the results of your lift study are based on the quality of the baseline we were able to generate against your goal data.
- Estimated Incremental Conversions - the number of additional conversions that we estimate you received after running this campaign
- Average Daily Conversions - the estimated average daily absolute lift in the target region over your baseline
- Percent Lift - the relative lift over the baseline over the course of your campaign
Hovering over the Lift Overview graph will show daily lifted conversions over the projected baseline:
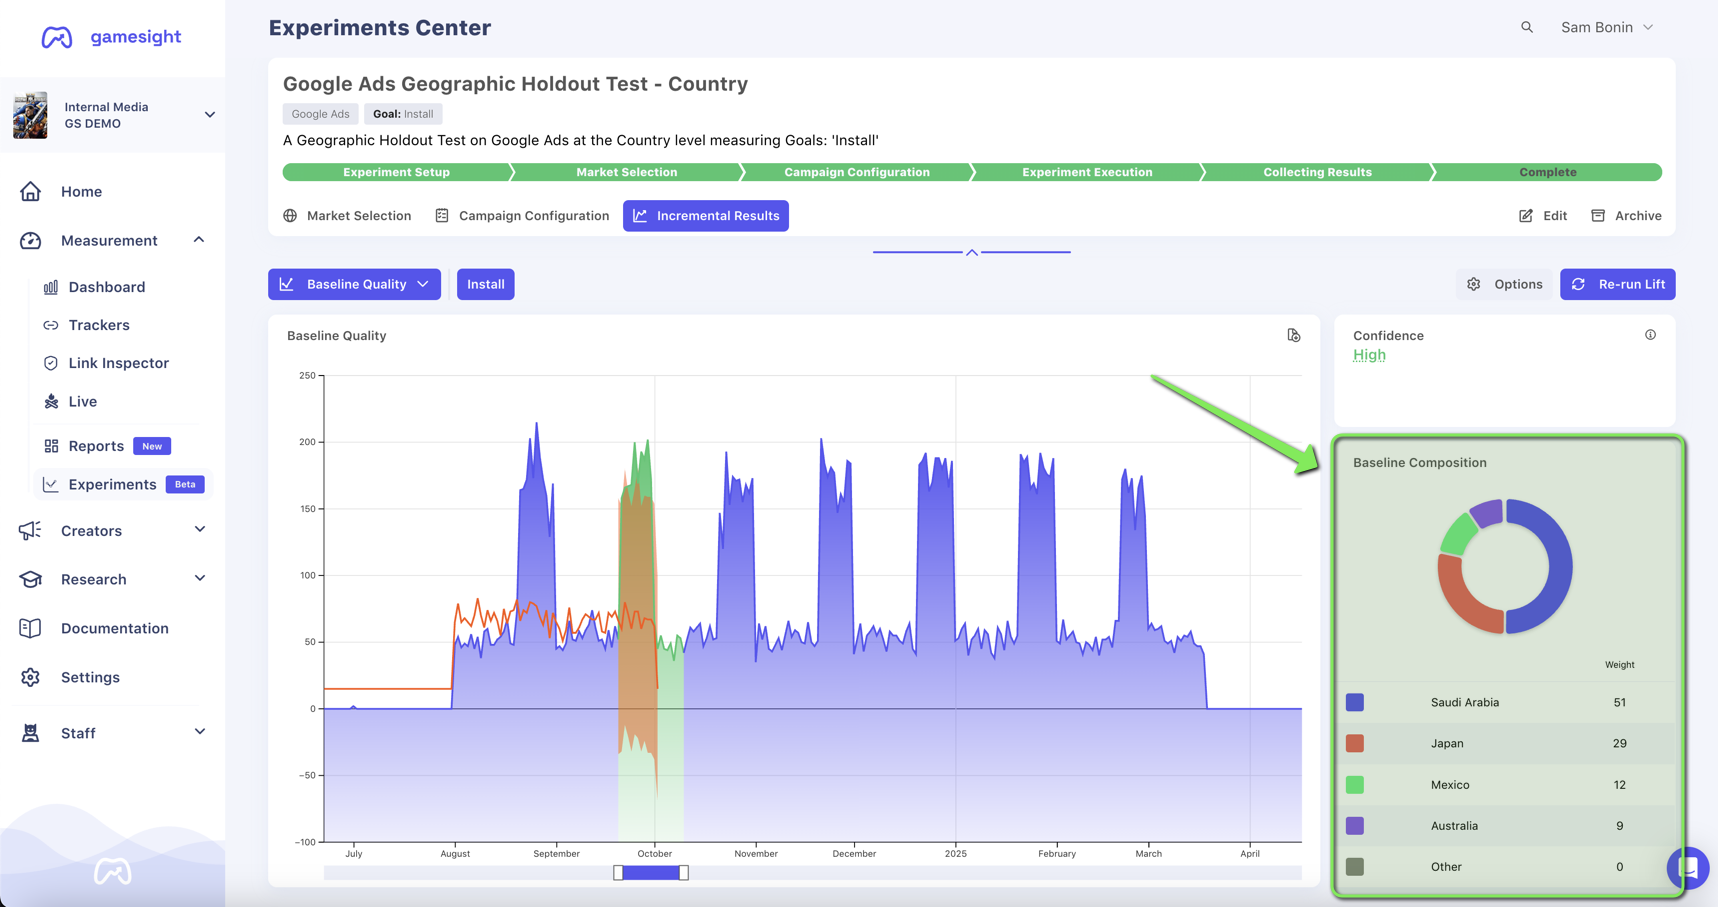
Baseline Quality
By comparing test region performance to your baseline, the Baseline Quality visualization gives you deeper insight into how well Incrementality was able to calculate your baseline control. In an ideal experiment, the baseline calculation in red should closely mimic the pre-campaign test region results in purple. During your campaign flight dates, the purple test region will change to green, and you should see your green results diverge from the red control. An estimated baseline range will appear during the campaign window, and in a successful experiment your test region results should be larger than the red window.
High-Quality BaselinesDigital marketing campaigns can take a while to optimize, and you may not see immediate results for your experiment (i.e. your test and control results may look similar for several days after your experiment begins).
If you are struggling to create a high-quality baseline for your experiment, please reach out to your Gamesight representative or contact [email protected].
The Baseline Quality analysis can be selected from the dropdown at the top left:
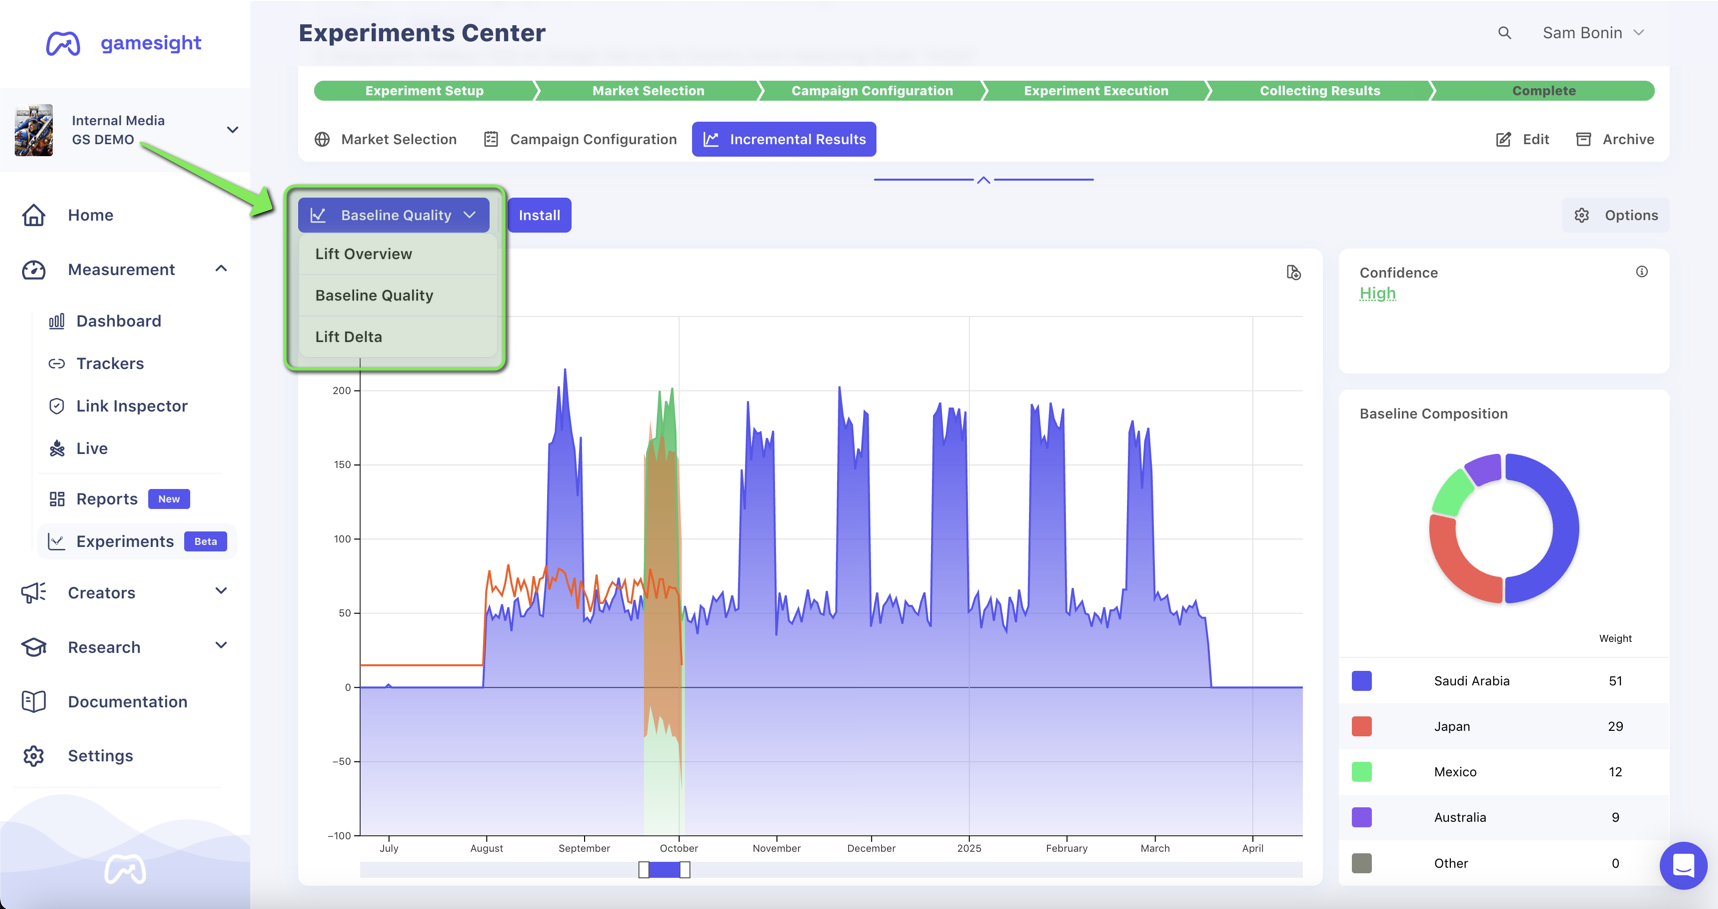
The projected baseline and it's estimated range during the experiment period appears in red, with the goal count in the target region during the experiment appearing in green.
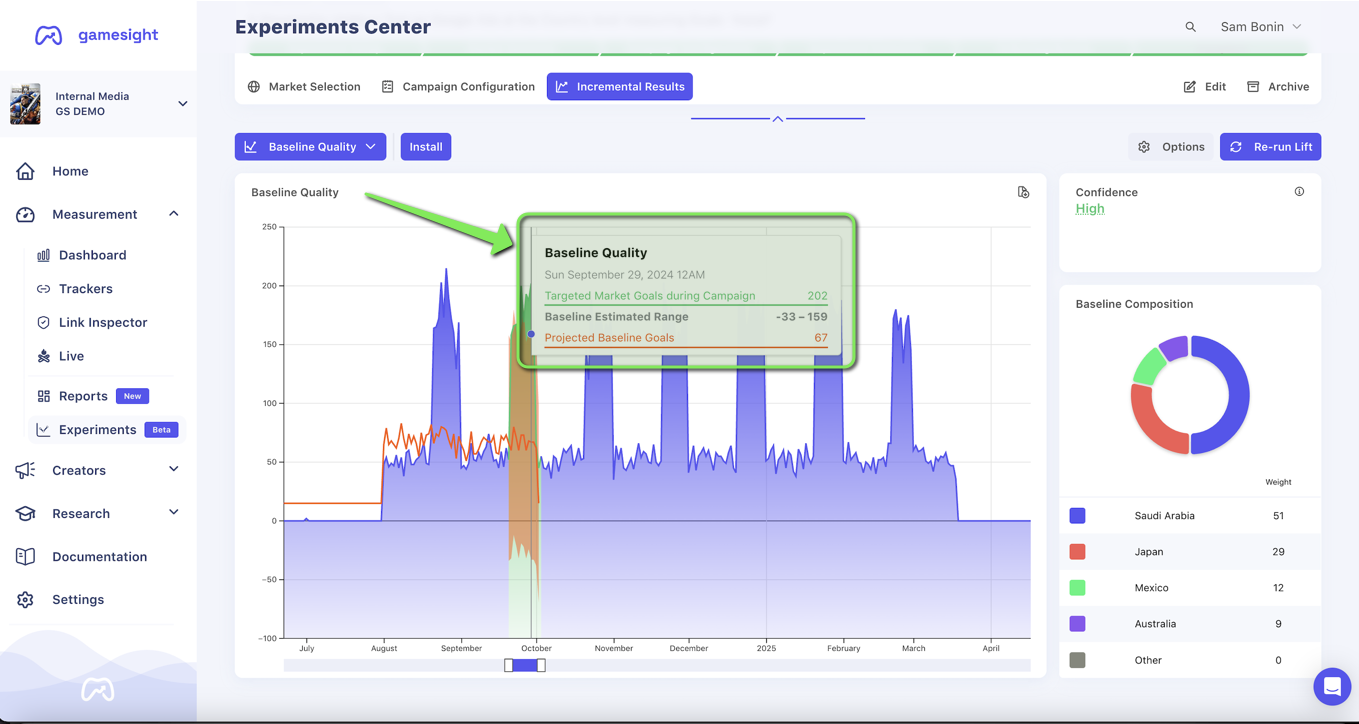
Your Baseline Composition indicates what control regions were used to construct your baseline, and their relative weights.
Check Your Baseline CompositionIf your baseline composition includes markets where you are currently running targeted advertising campaigns, excluding these markets from the lift calculation may improve your baseline.
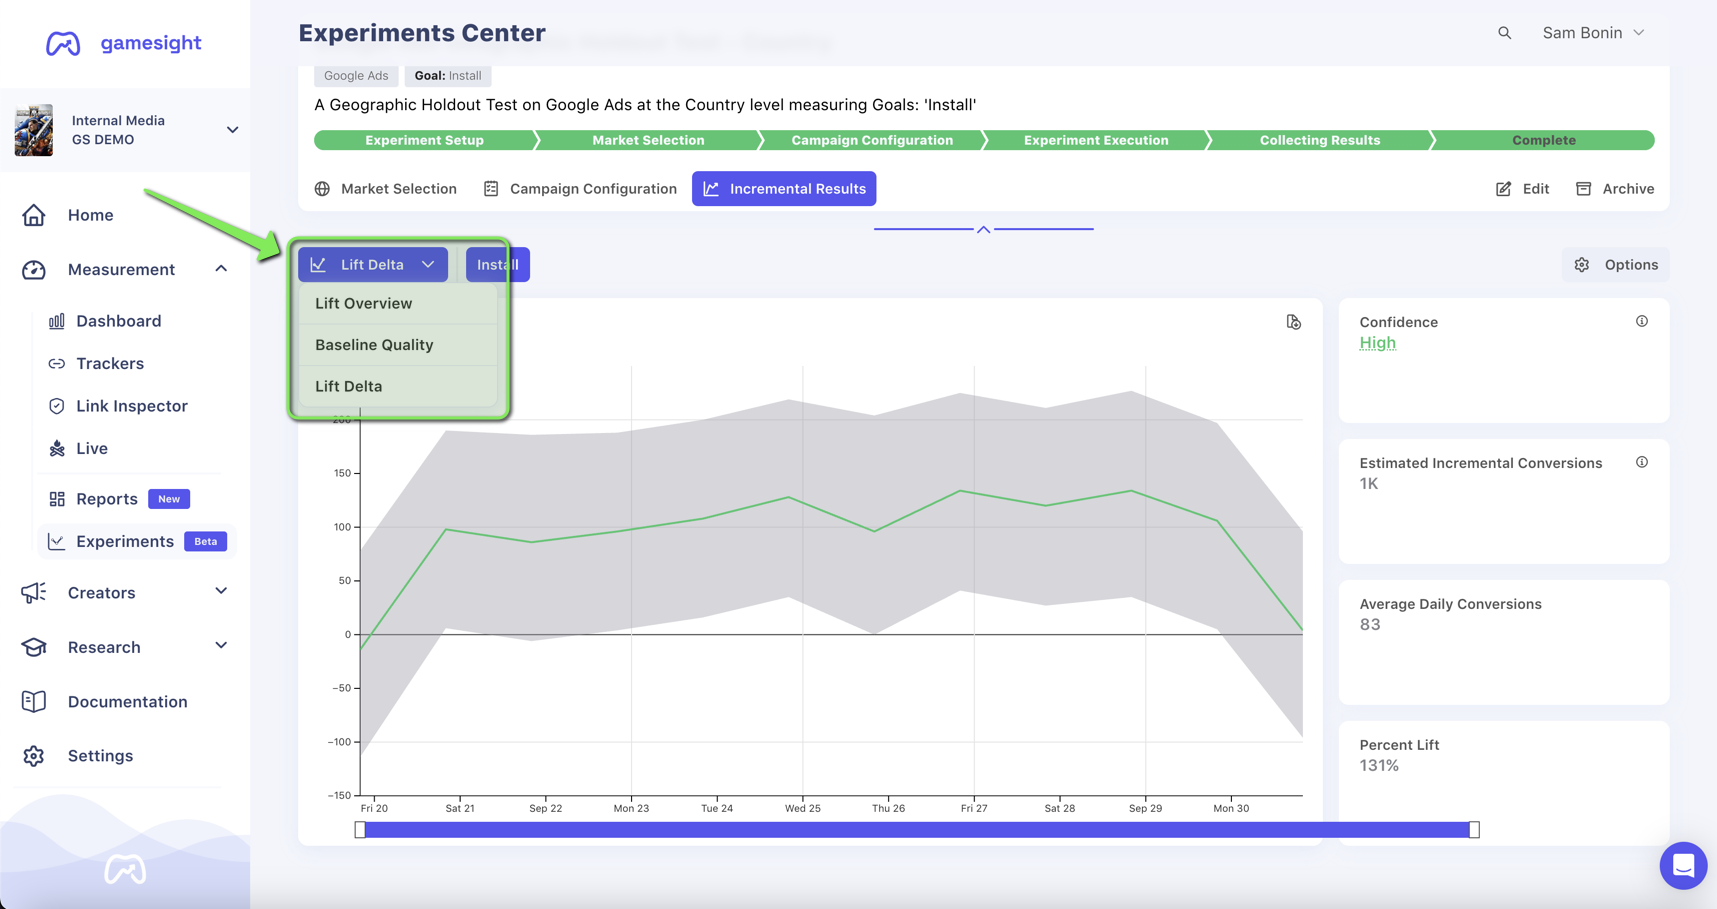
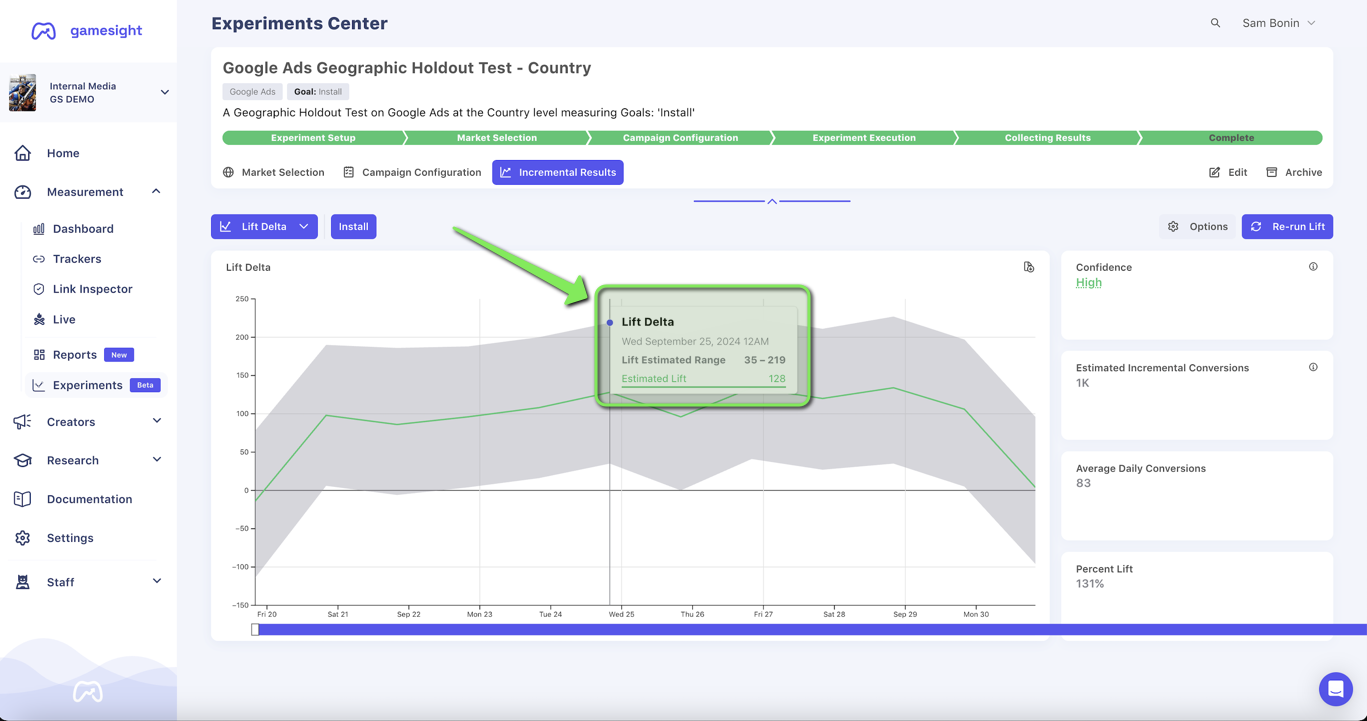
Lift Delta
Similar to the Baseline Quality analysis, the Lift Delta visualization provides information about the quality of results from your experiment. In an ideal experiment, you will see the green estimated lift line increase over time, with the lift over your baseline represented by the y-axis. In successful tests, the lower bound of your confidence interval should also eventually be greater than 0. After the conclusion of your experiment, it's normal to see your performance decay over time.
High-Quality BaselinesDigital marketing campaigns can take a while to optimize, and you may not see immediate results for your experiment (i.e. your lift delta may be close to 0 for several days after the start of your experiment).
If you are struggling to create a high-quality baseline for your experiment, please reach out to your Gamesight representative or contact [email protected].
The Lift Delta analysis can be selected from the dropdown at the top left:
Hovering your cursor over the graph will show the daily estimated lift, as well as the confidence interval for that date:
Updated over 1 year ago
What’s Next
Let's review what it takes to run a successful incrementality experiment.