Reporting Use Cases
This document provides some helpful guidance on how to use the Reporting Dashboard, along with some common use cases and deeper dives.
Common Report Types
The Campaigns report will display all campaigns and their performance during the timeframe you select and the applied reporting filters. This report will specifically display all impressions, clicks, and conversions that occurred during the specified time and which networks the conversions were attributed to. However, there is a fair amount of granularity that can be added to the Campaigns report by using the Filters and Display tabs to customize your reports. Below, we will take a look at some common reports that our partners generate on a daily basis.
Standard Campaign Report
This basic campaign report has a focus on network reported clicks and impressions, clicks and impressions measured by Gamesight, attributed and unattributed conversions/Goals, and ROAS. You can access this report by clicking "Campaigns" in your dashboard.
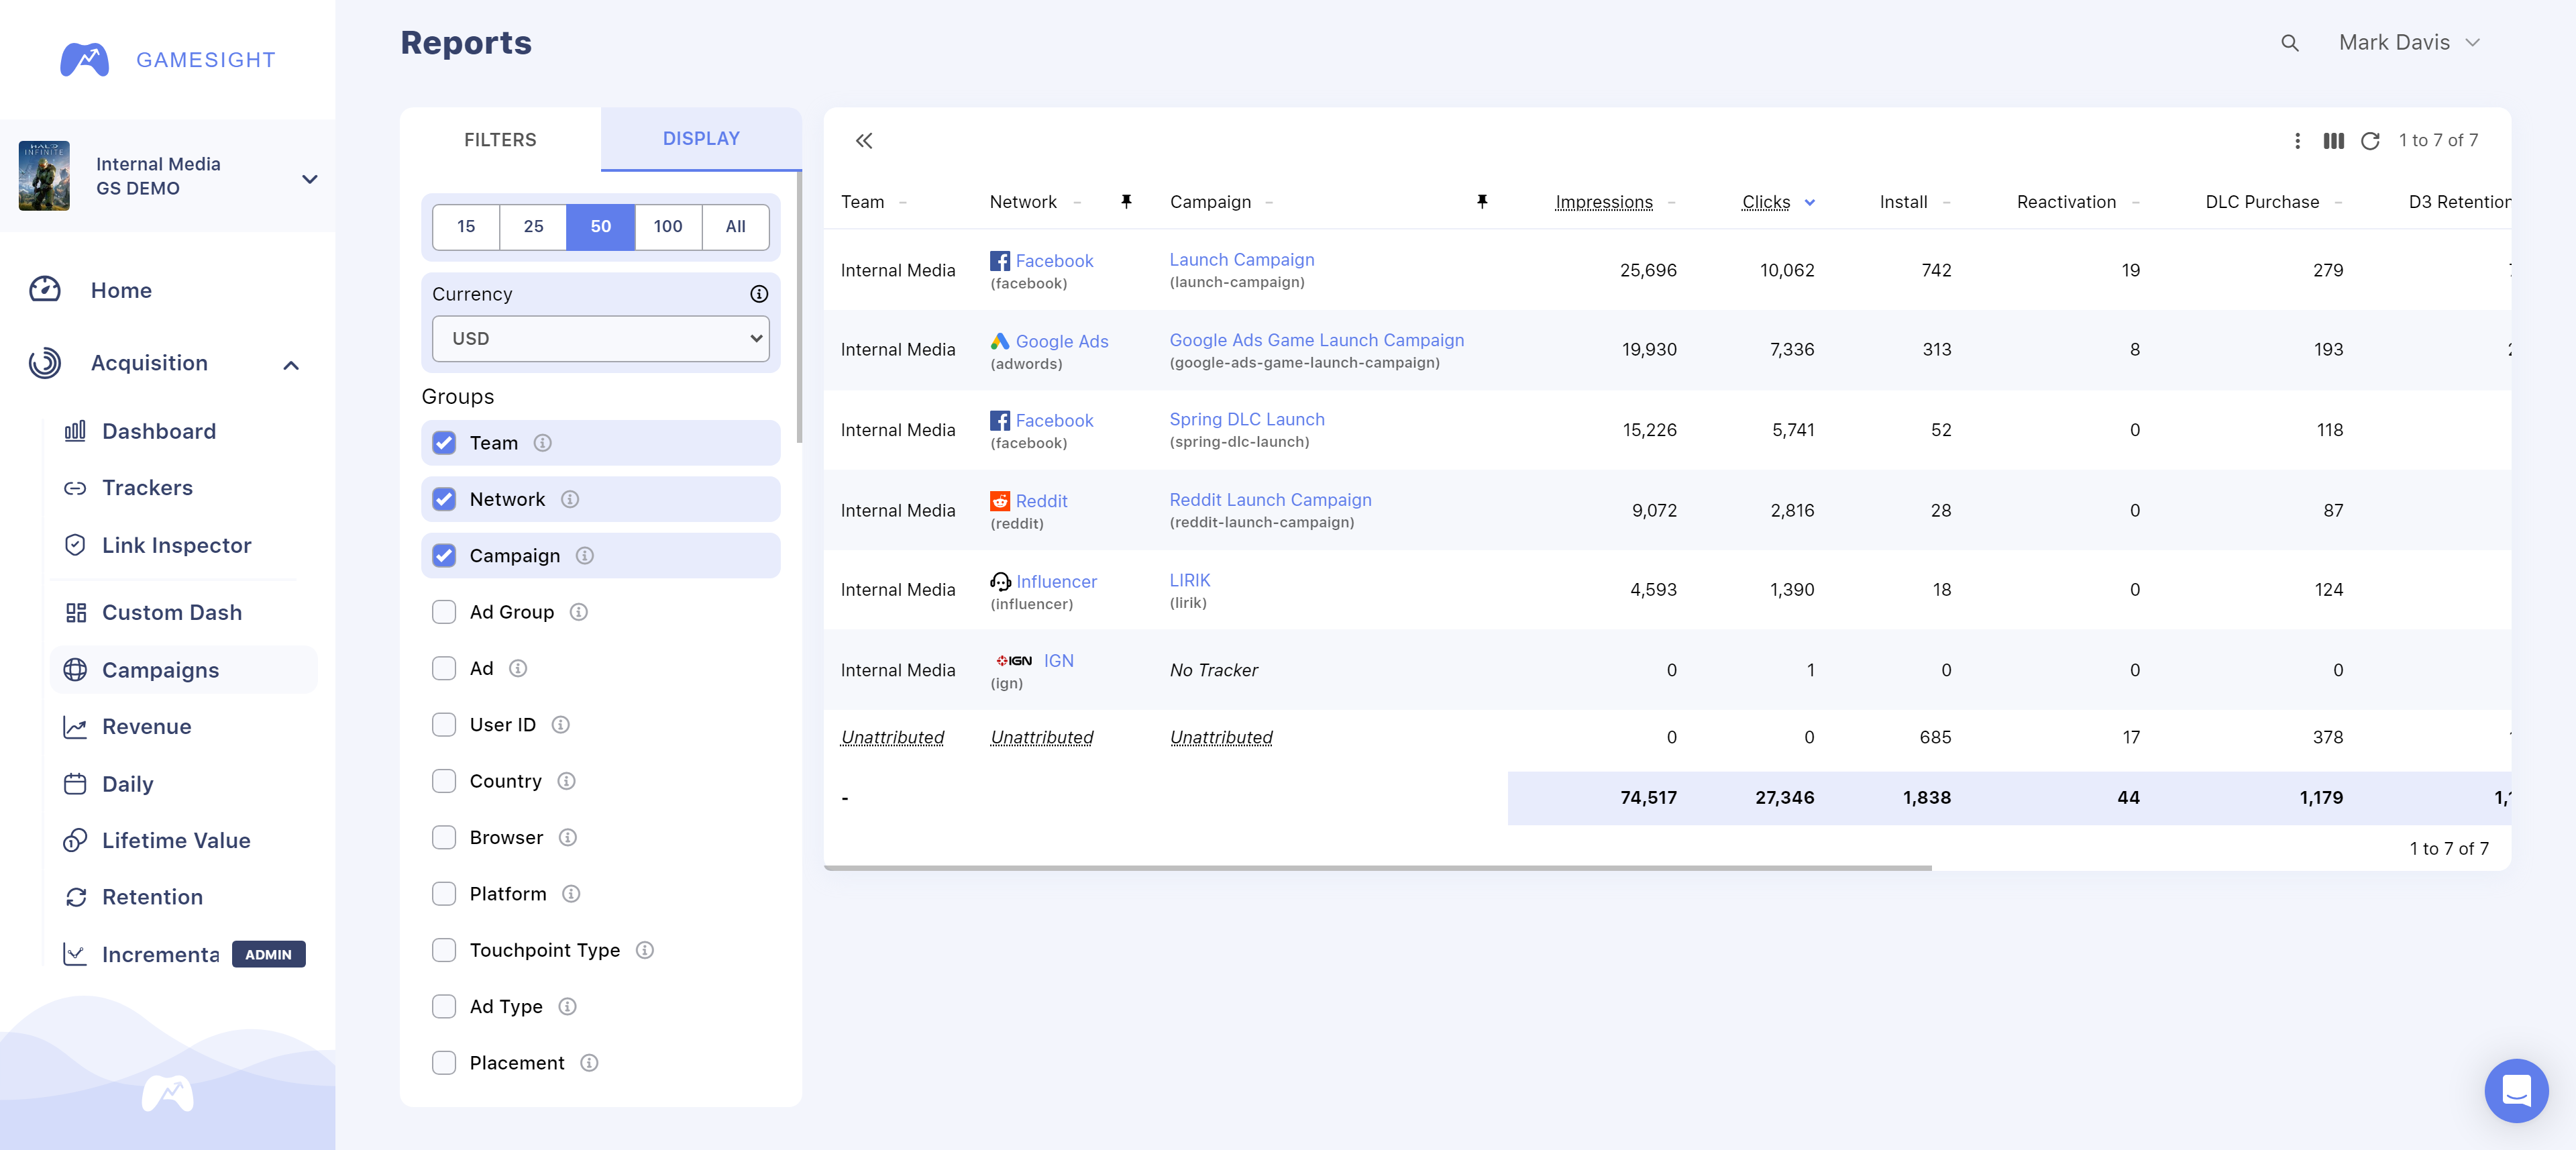
Additional metrics can be added to this standard Campaigns report by enabling available options on both the Filters and Display tabs. This report can be as complex or as simple as you need it to be. You can find our Reporting Metrics and definitions here.
Modeled Goals and Revenue
Last Touch
Last touch attribution is the default setting in all Gamesight reports. This model assigns 100% credit to the last interaction on one of your touchpoints in the user flow prior to conversion.
This model is simple to understand and is useful for optimizing bottom-funnel marketing efforts. However, it can overlook the role of upper-funnel efforts such as brand or awareness campaigns.
First Touch
First touch assigns 100% of the conversion credit to the first interaction in the user flow.
This attribution model tends to highlight efforts built to drive player awareness at the top of the funnel, but may undervalue interactions that move customers through the funnel from awareness to conversion.
Linear
Linear attribution modeling equally distributes the credit for a conversion across all touchpoints that the player engaged with on their journey.
This model gives value to every interaction on the path to conversion. Some marketers see this as a more holistic approach to assigning conversion credit.
Linear modeling assumes that each touchpoint is of equal value, which may not always be the case. This model may not provide clear insights into which campaigns you should optimize.
Position
Position-based (u-shaped) attribution models give 40% of the credit to the first and last touchpoint and assign the remaining 20% evenly across the other touchpoints in the middle of the player journey.
This model recognizes the importance of initial awareness and the decision stage of the funnel while not completely discounting the middle of the journey. This provides a more nuanced interpretation of the user journey.
Every marketing campaign is different, and the preset distribution may not accurately reflect the true influence or importance of the upper and lower funnel touchpoints.
Time Decay
Time decay assigns the most credit to the touchpoint closest to the time of conversion. Conversions further back in time prior to the conversion get less credit; decaying with a 1-day half-life.
This is a dynamic method of modeling attribution for performance marketing that reflects the increasing importance of touchpoints as the player gets closer to converting.
Time decay modeling, like many other models, may undervalue the importance of upper-funnel marketing efforts and touchpoints.
Lifetime Value and Player Retention
Gamesight actively tracks Lifetime Value (LTV) and Player Retention and "cohorts" players based on how they were originally acquired/attributed. Our Lifetime Value report will show every purchase (gross revenue) that players attributed to a specific campaign made in total (in-game purchases, DLC, etc.) over their lifetime. The time range settings do not impact the total revenue reported for a specific user as it will always display their lifetime revenue.
Using the Lifetime Value and Retention reports in Gamesight will allow you to compare LTV and Retention metrics between different ad networks, different platforms, etc.
Geo Performance
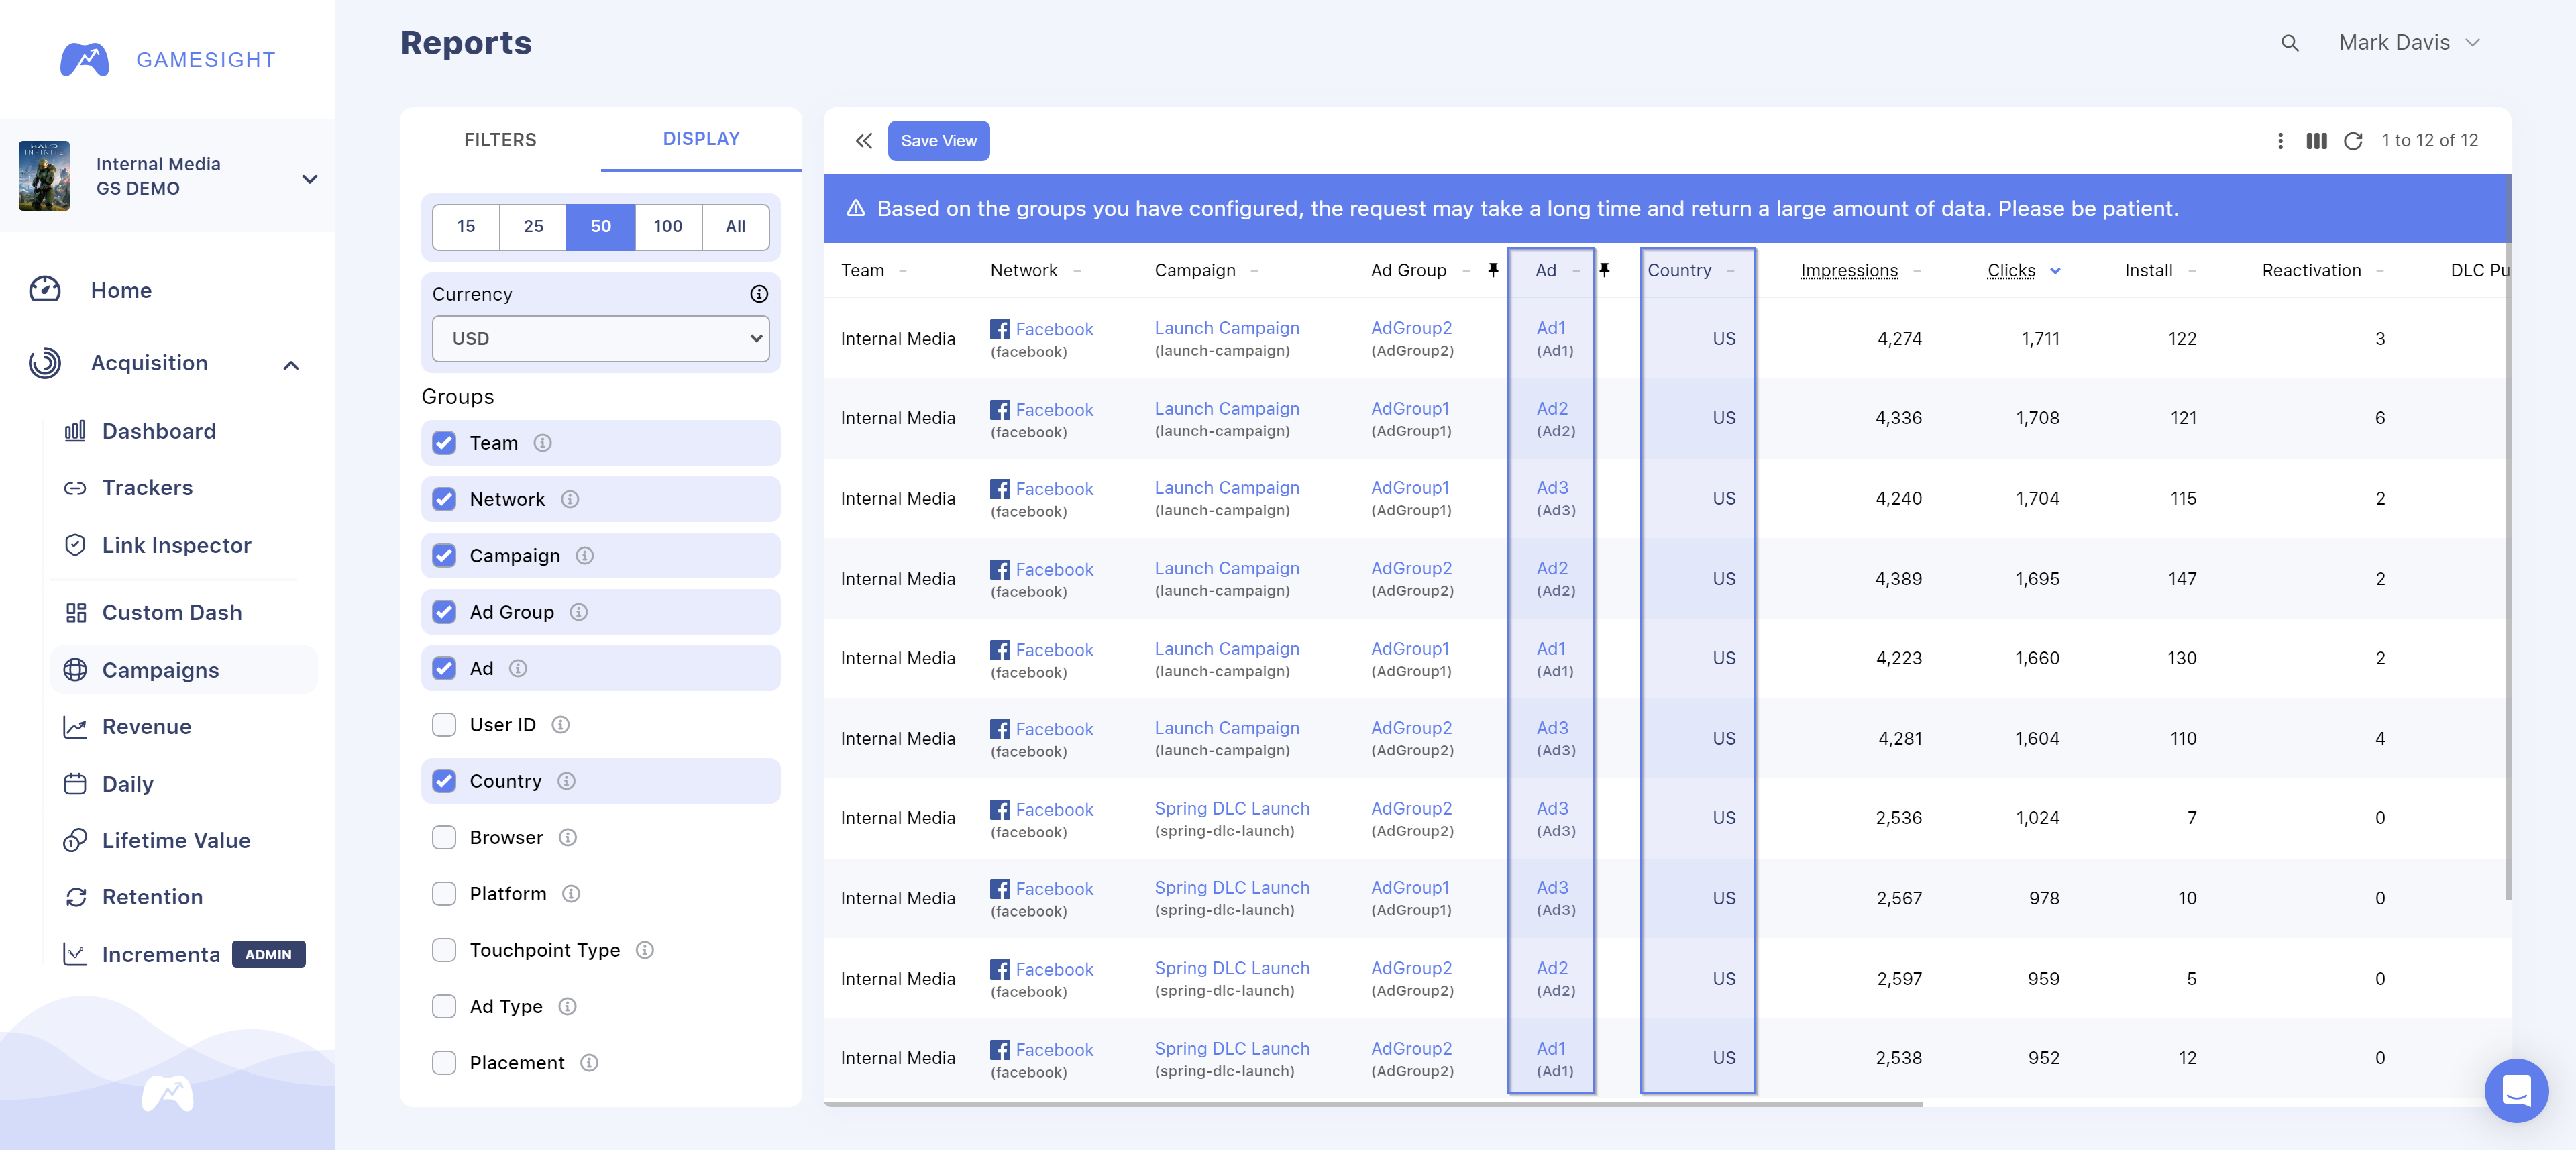
Gamesight offers a country-level breakdown throughout reporting, allowing marketers to see how their campaigns resonate with audiences around the world.
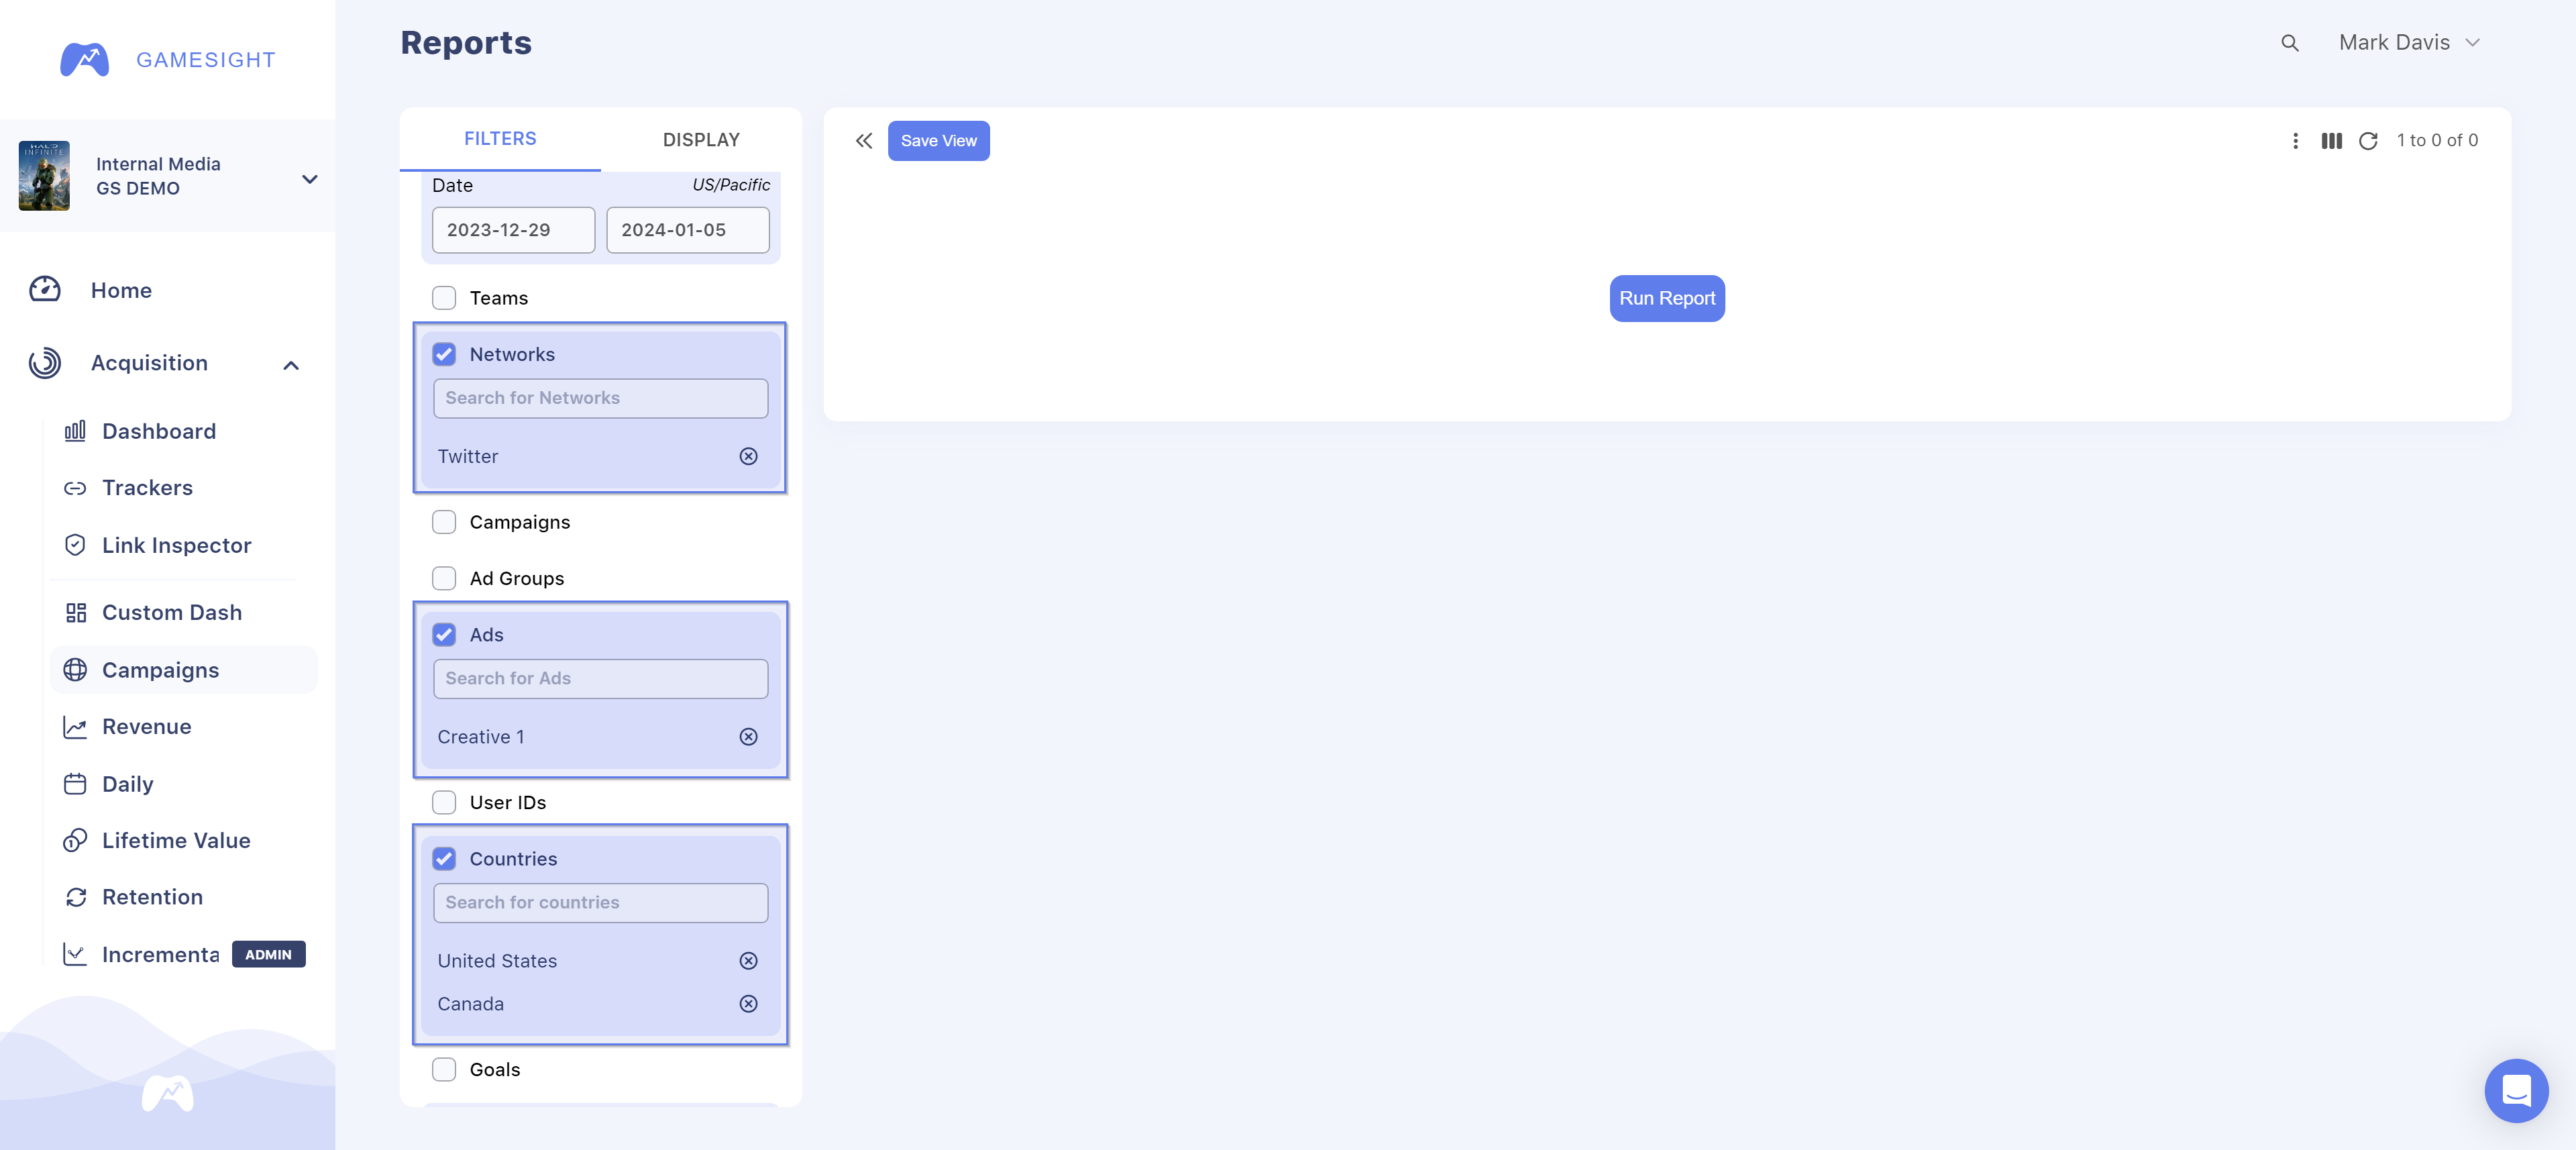
For example, let’s say you want to see ROAS for a specific Facebook ad you ran in the US and Canada. You can run this exact report on the Campaigns reporting page by following these steps:
- Select the “Networks” checkbox and type in “Facebook”
- Select the “Ads” checkbox under filters, and type in the name of your Facebook ad
- Select the “Country” checkbox and add the United States and Canada
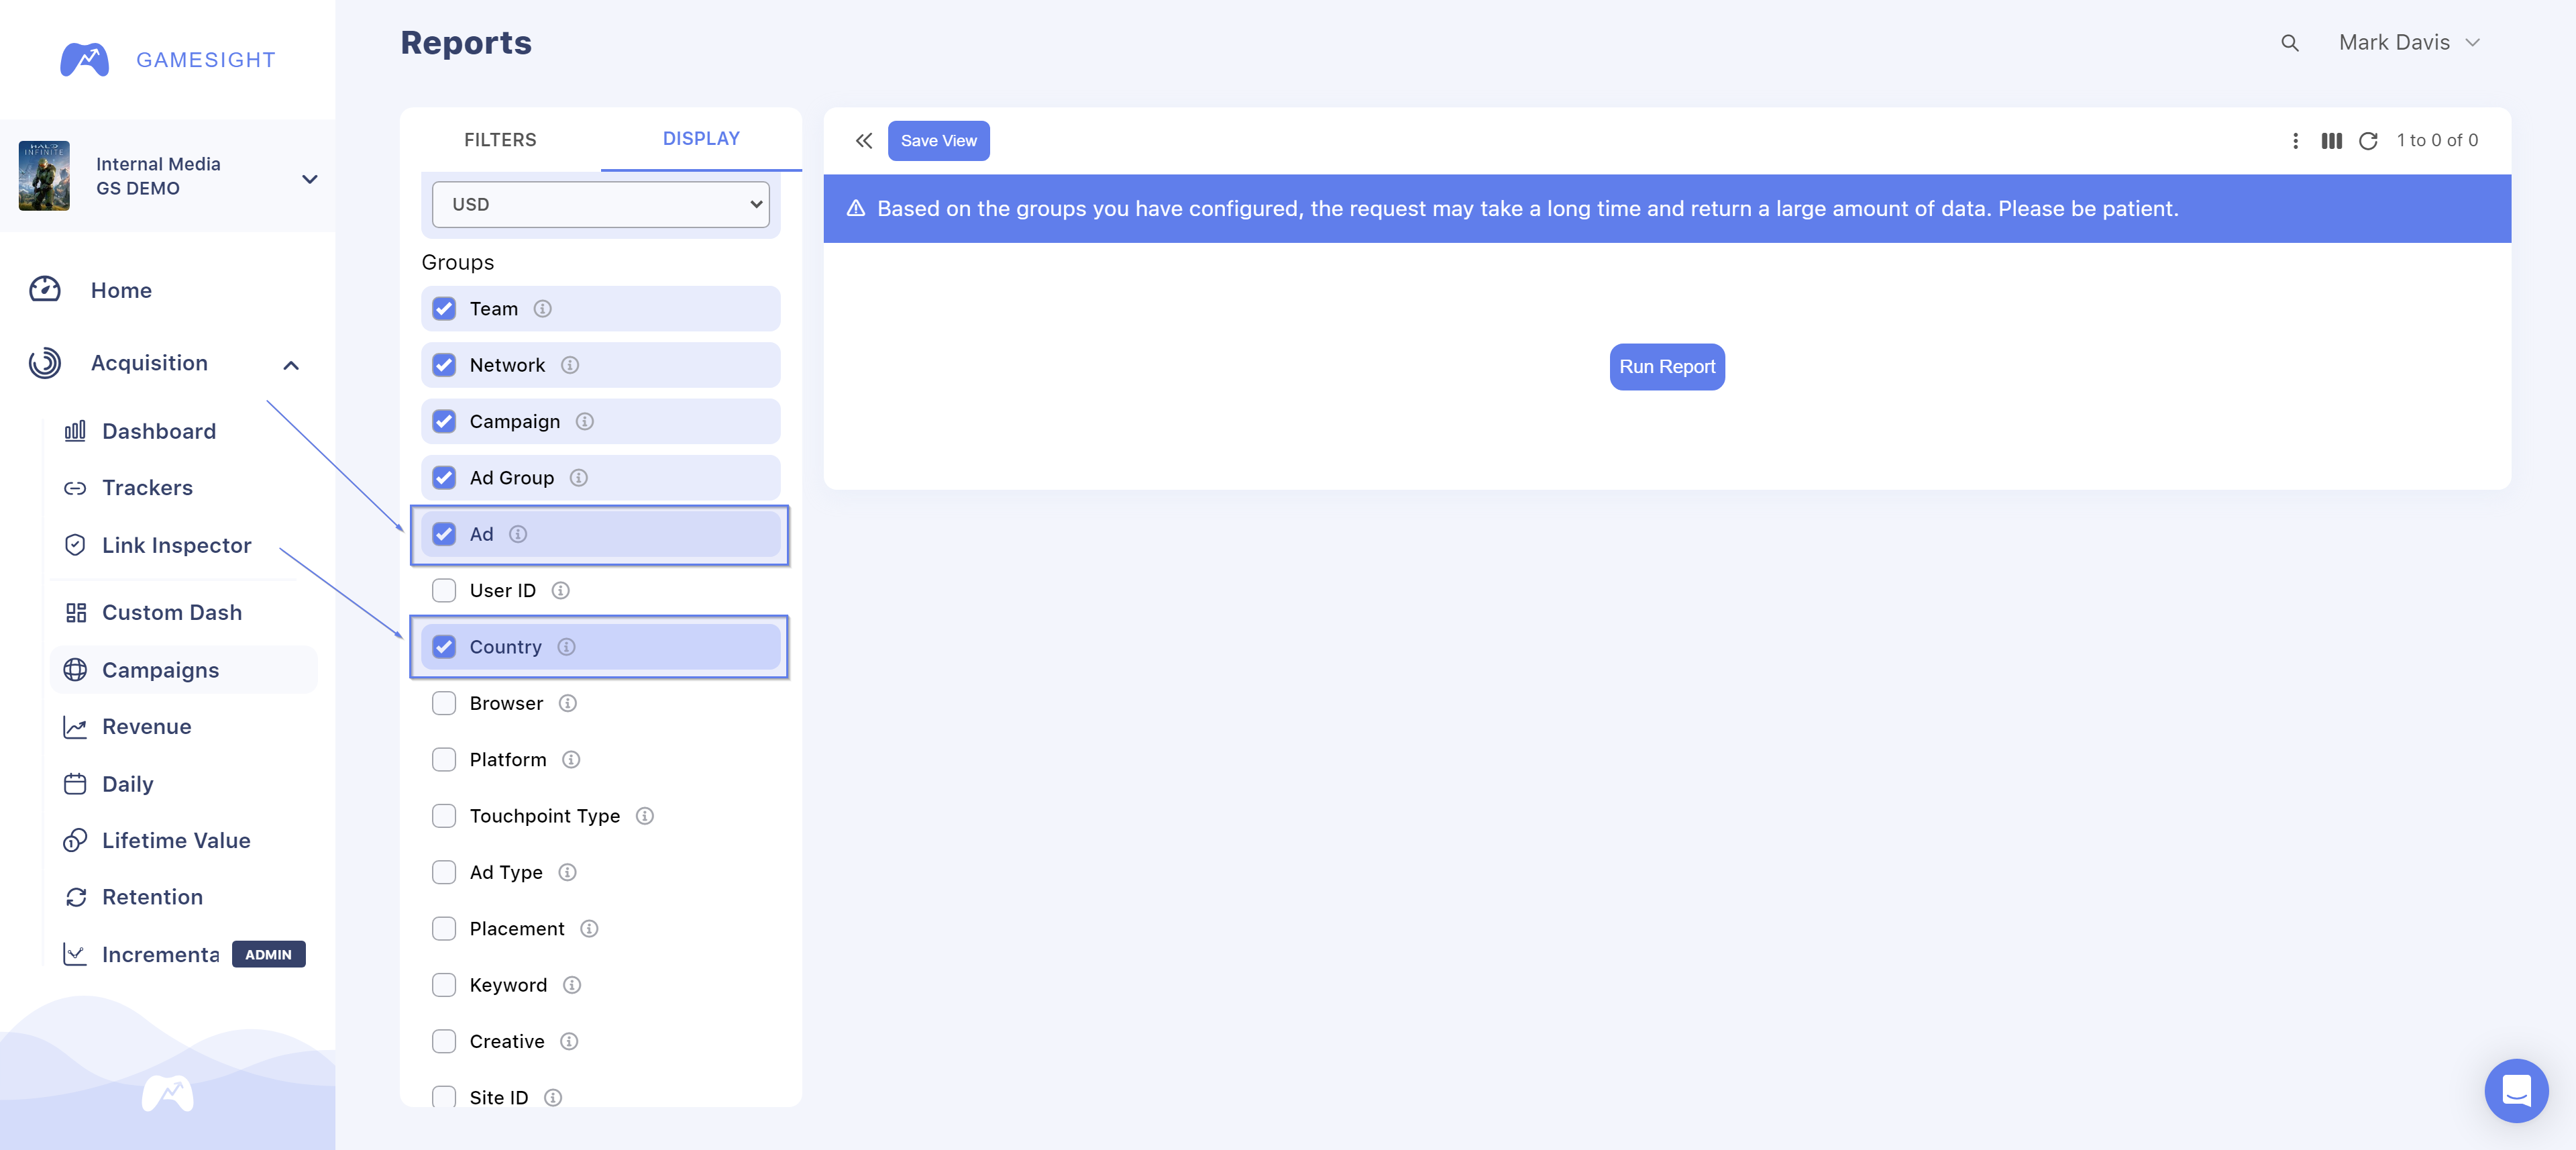
- Click the Display tab at the top left
- Check the following boxes:
• “Ad” and “Country” under Groups
• “ROAS” under metrics40 - Run your report!
Geo Performance by NetworkSome networks like Google Ads do not allow for a Geo+Cost breakdown resulting in Cost not being available and ROAS not being calculated at a more granular level. Cost and ROAS are available at the Campaign, Ad Group and Ad levels though.
Platform Performance
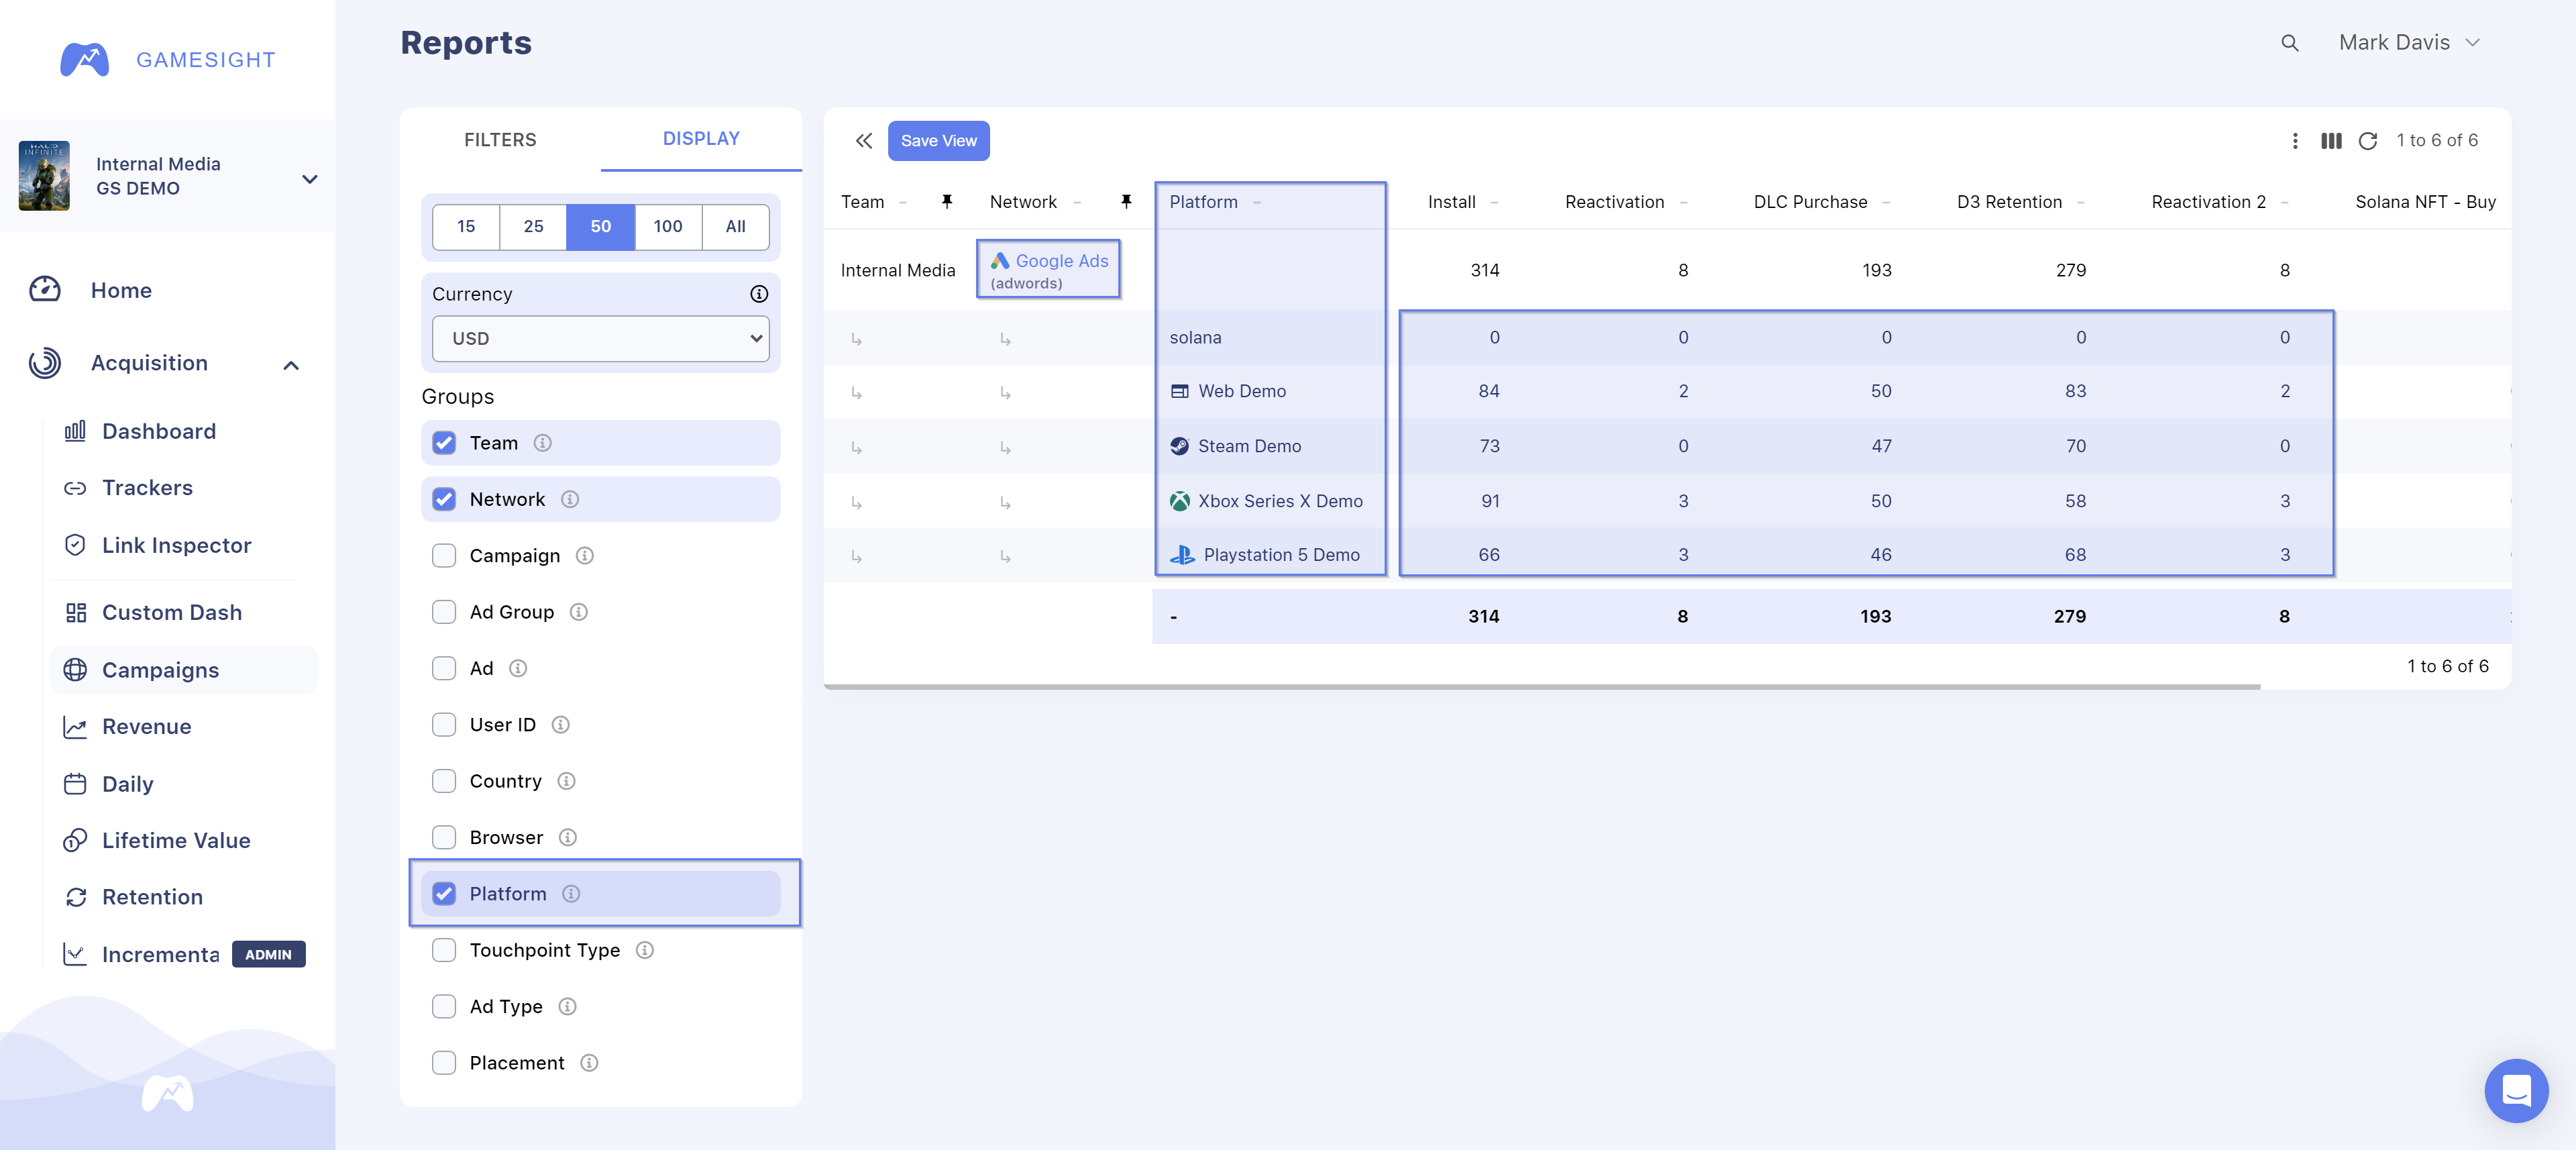
Gamesight attribution works for all platforms, including Steam, Xbox, PlayStation, and Epic Games Store. Reporting can be broken down by platform as well. For example, let’s say you want to compare Google Ads network goal attribution rates on Xbox and PlayStation:
- Select the “Networks” checkbox and type in “Google Ads”
- Click the Display tab in the top left
- Check the following boxes:
• “Network” and “Platform” under groups - Scroll down and select “Goals” under metrics
- Run your report!
Updated 10 months ago