Reports Dashboard
This document will walk you through the Reporting Dashboard and its features in Gamesight Console. On the Reports page, you will find a listing of all of the Reports and Dashboards for you team.
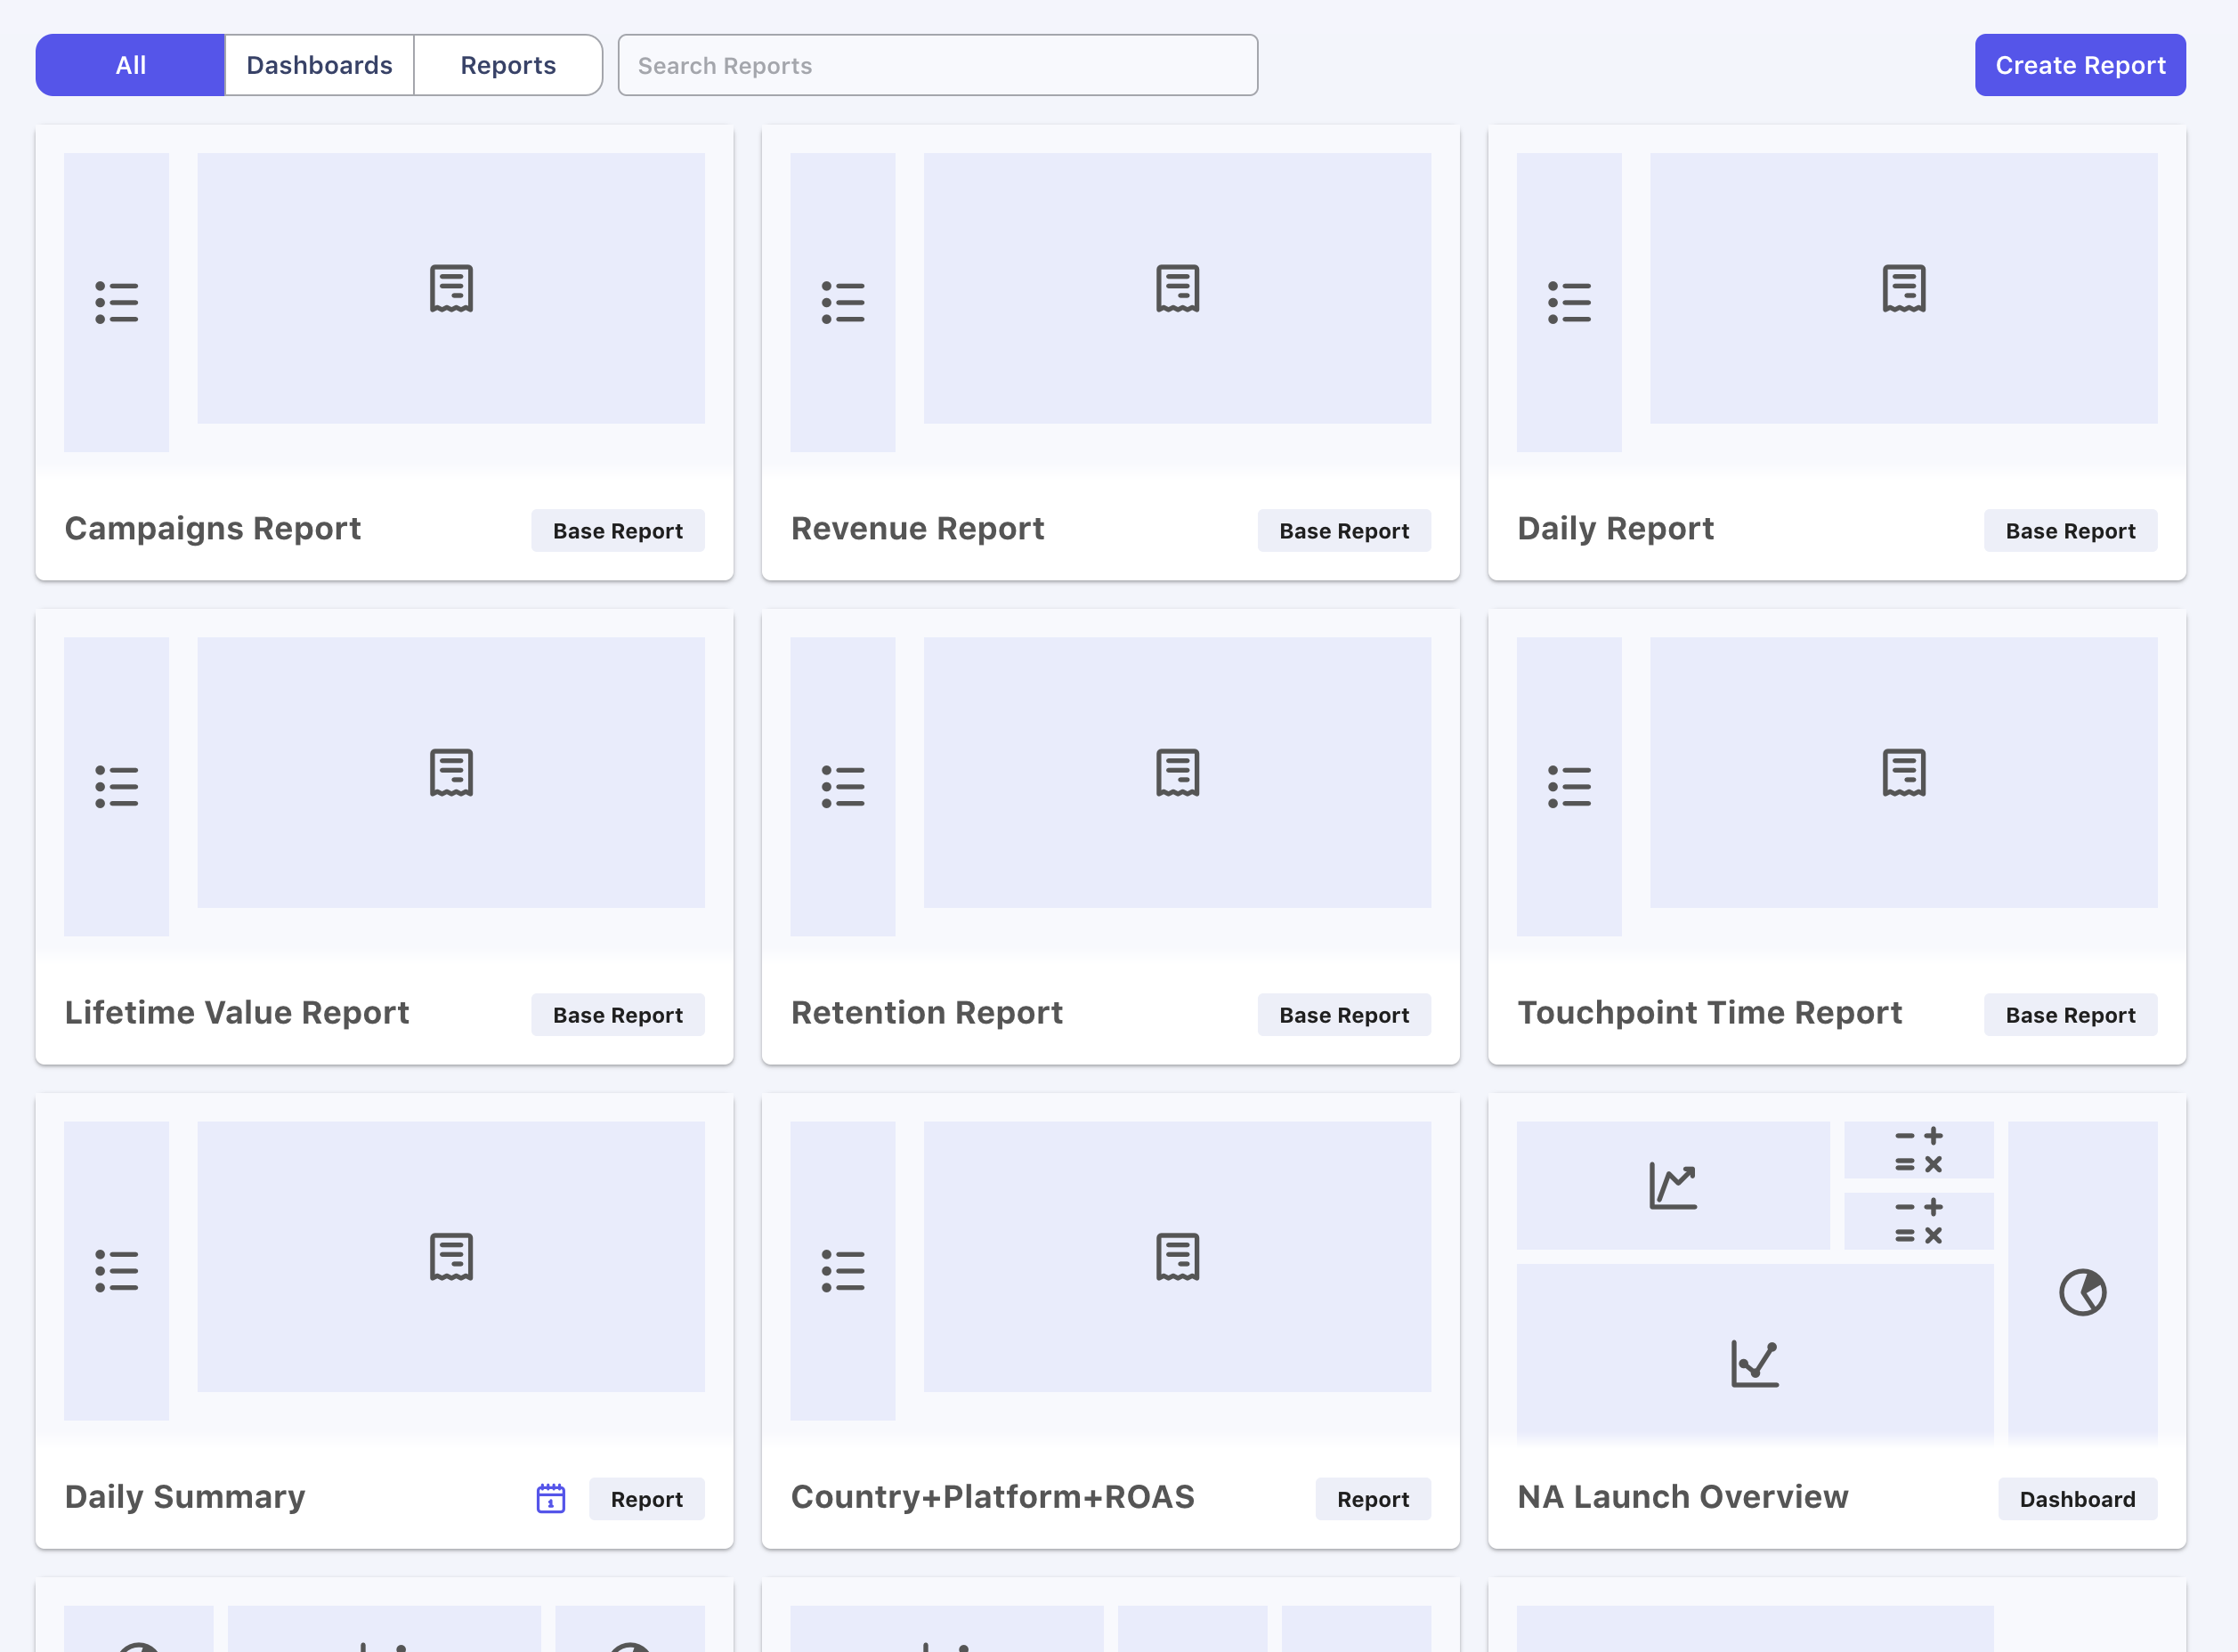
Reports listing page
There are three types of tiles that you will see on the Reports page
- Base Report - Standard built-in reports that are good starting point for a number of different regular reporting tasks. You can read more details about these reports in the Base Reports section of this document.
- Report - Custom reports that you or your team have created through the Custom Reports tooling.
- Dashboard - Custom Dashboards that you or your team have created highlighting key reports or KPIs for your game.
Base Reports
We provide a number of built-in reports that are good starting point for a number of different regular reporting tasks. In this section, you can find details about each of their reports and their use cases.
Campaigns Report
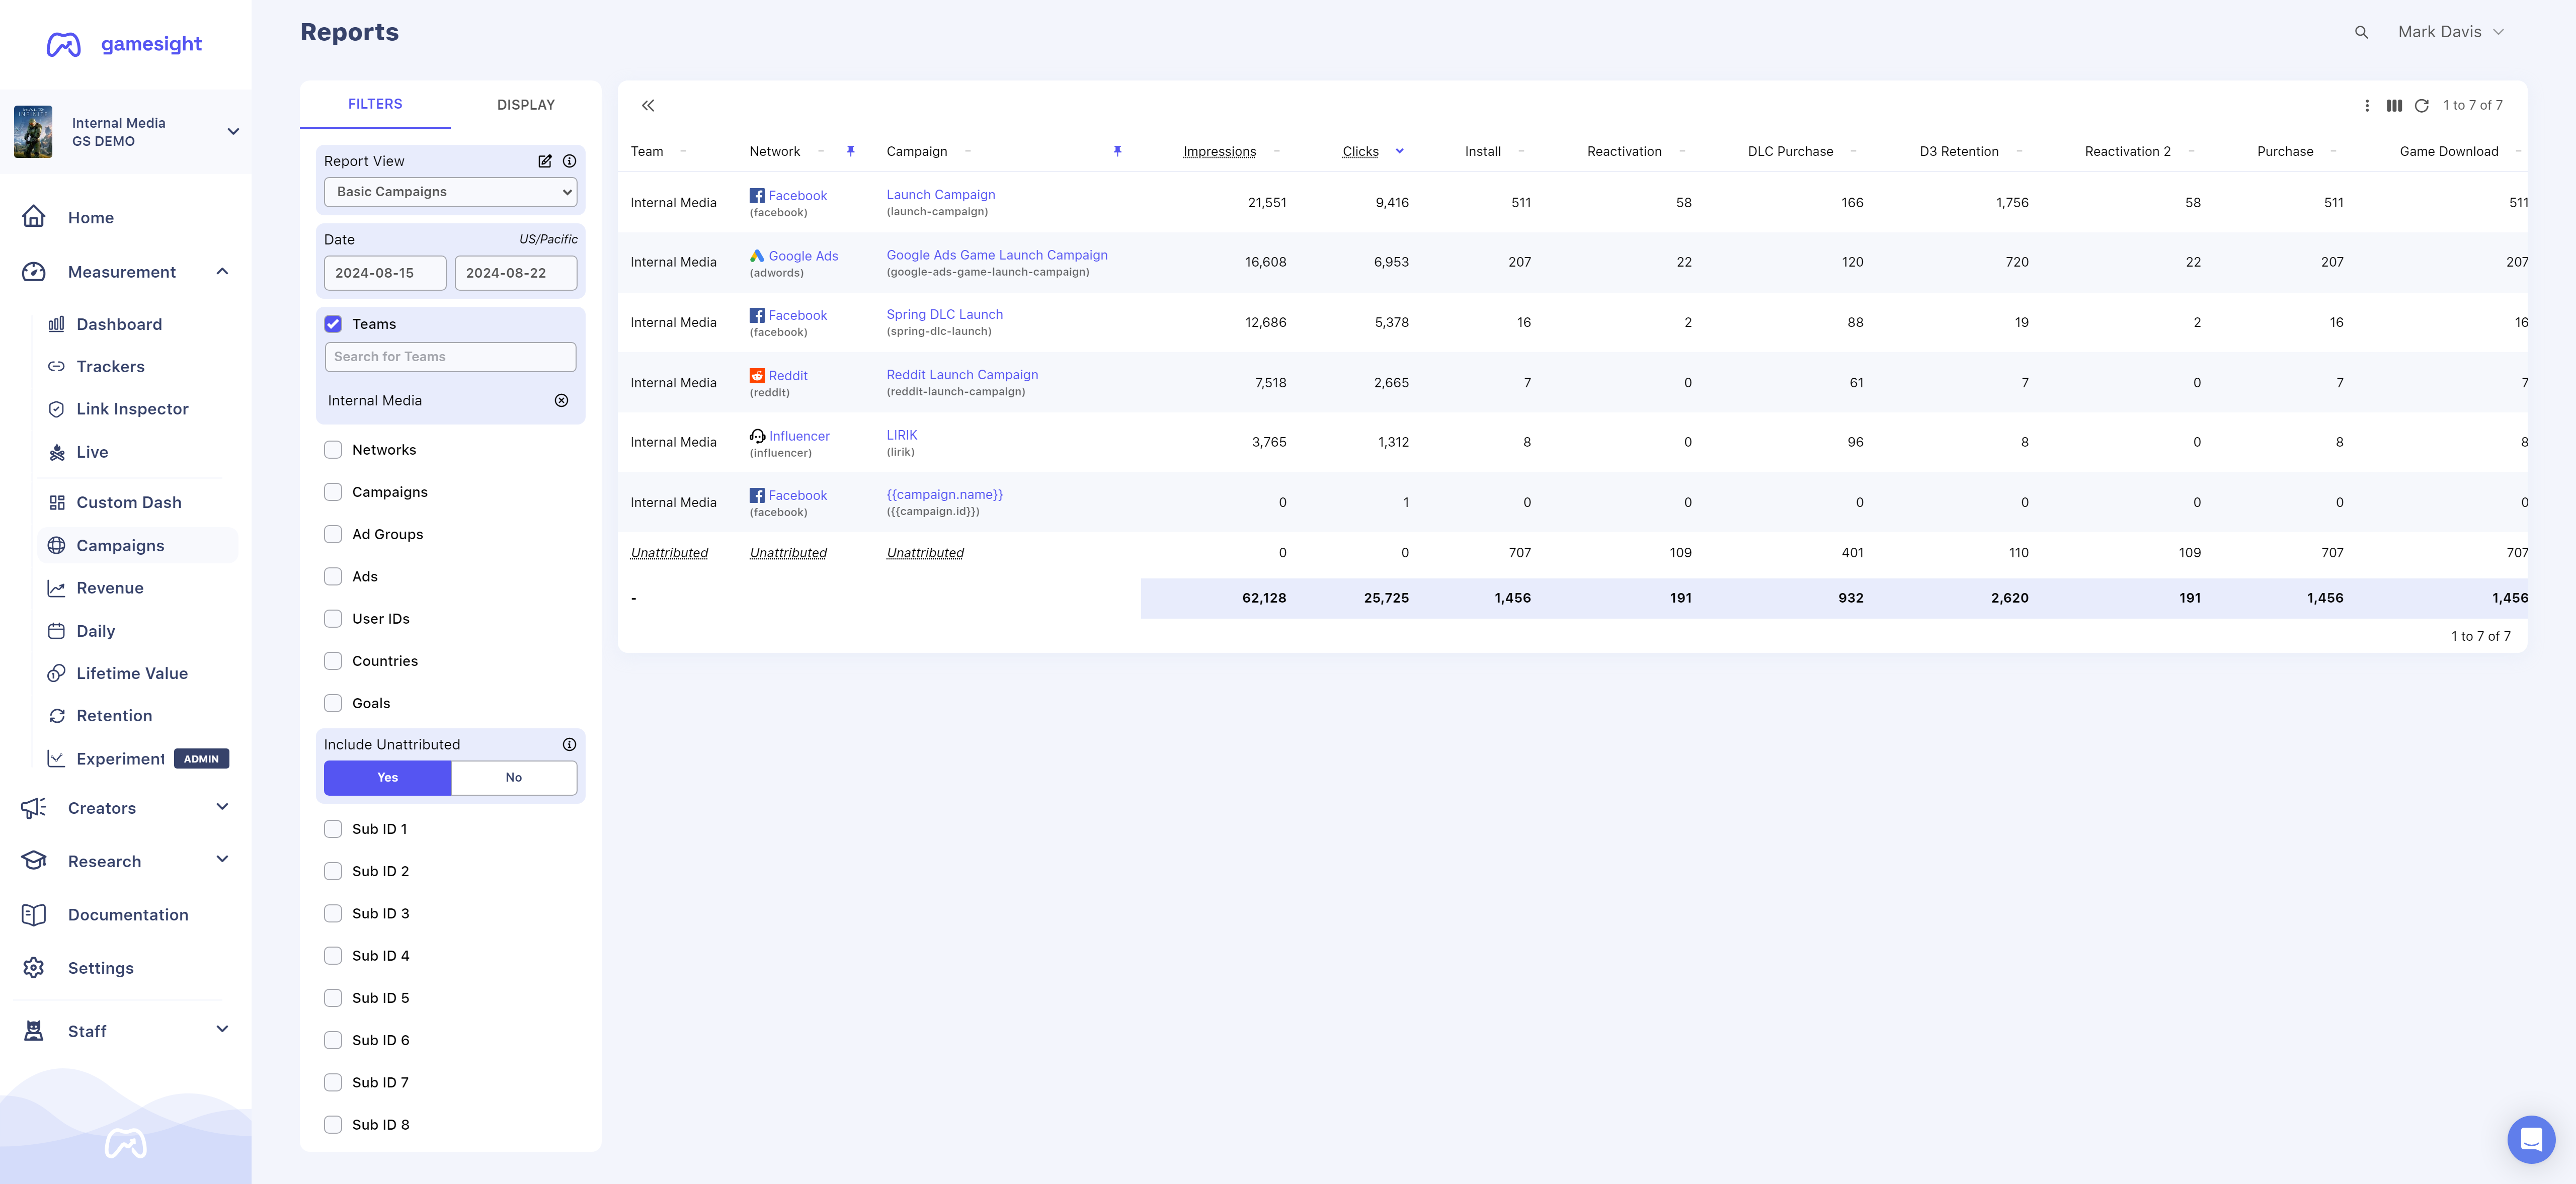
The Campaigns report will display all campaigns and their performance during the timeframe you select and the applied reporting filters.
In the image below, you will see campaigns being run on different networks and how they performed during the selected date range.
Revenue Report
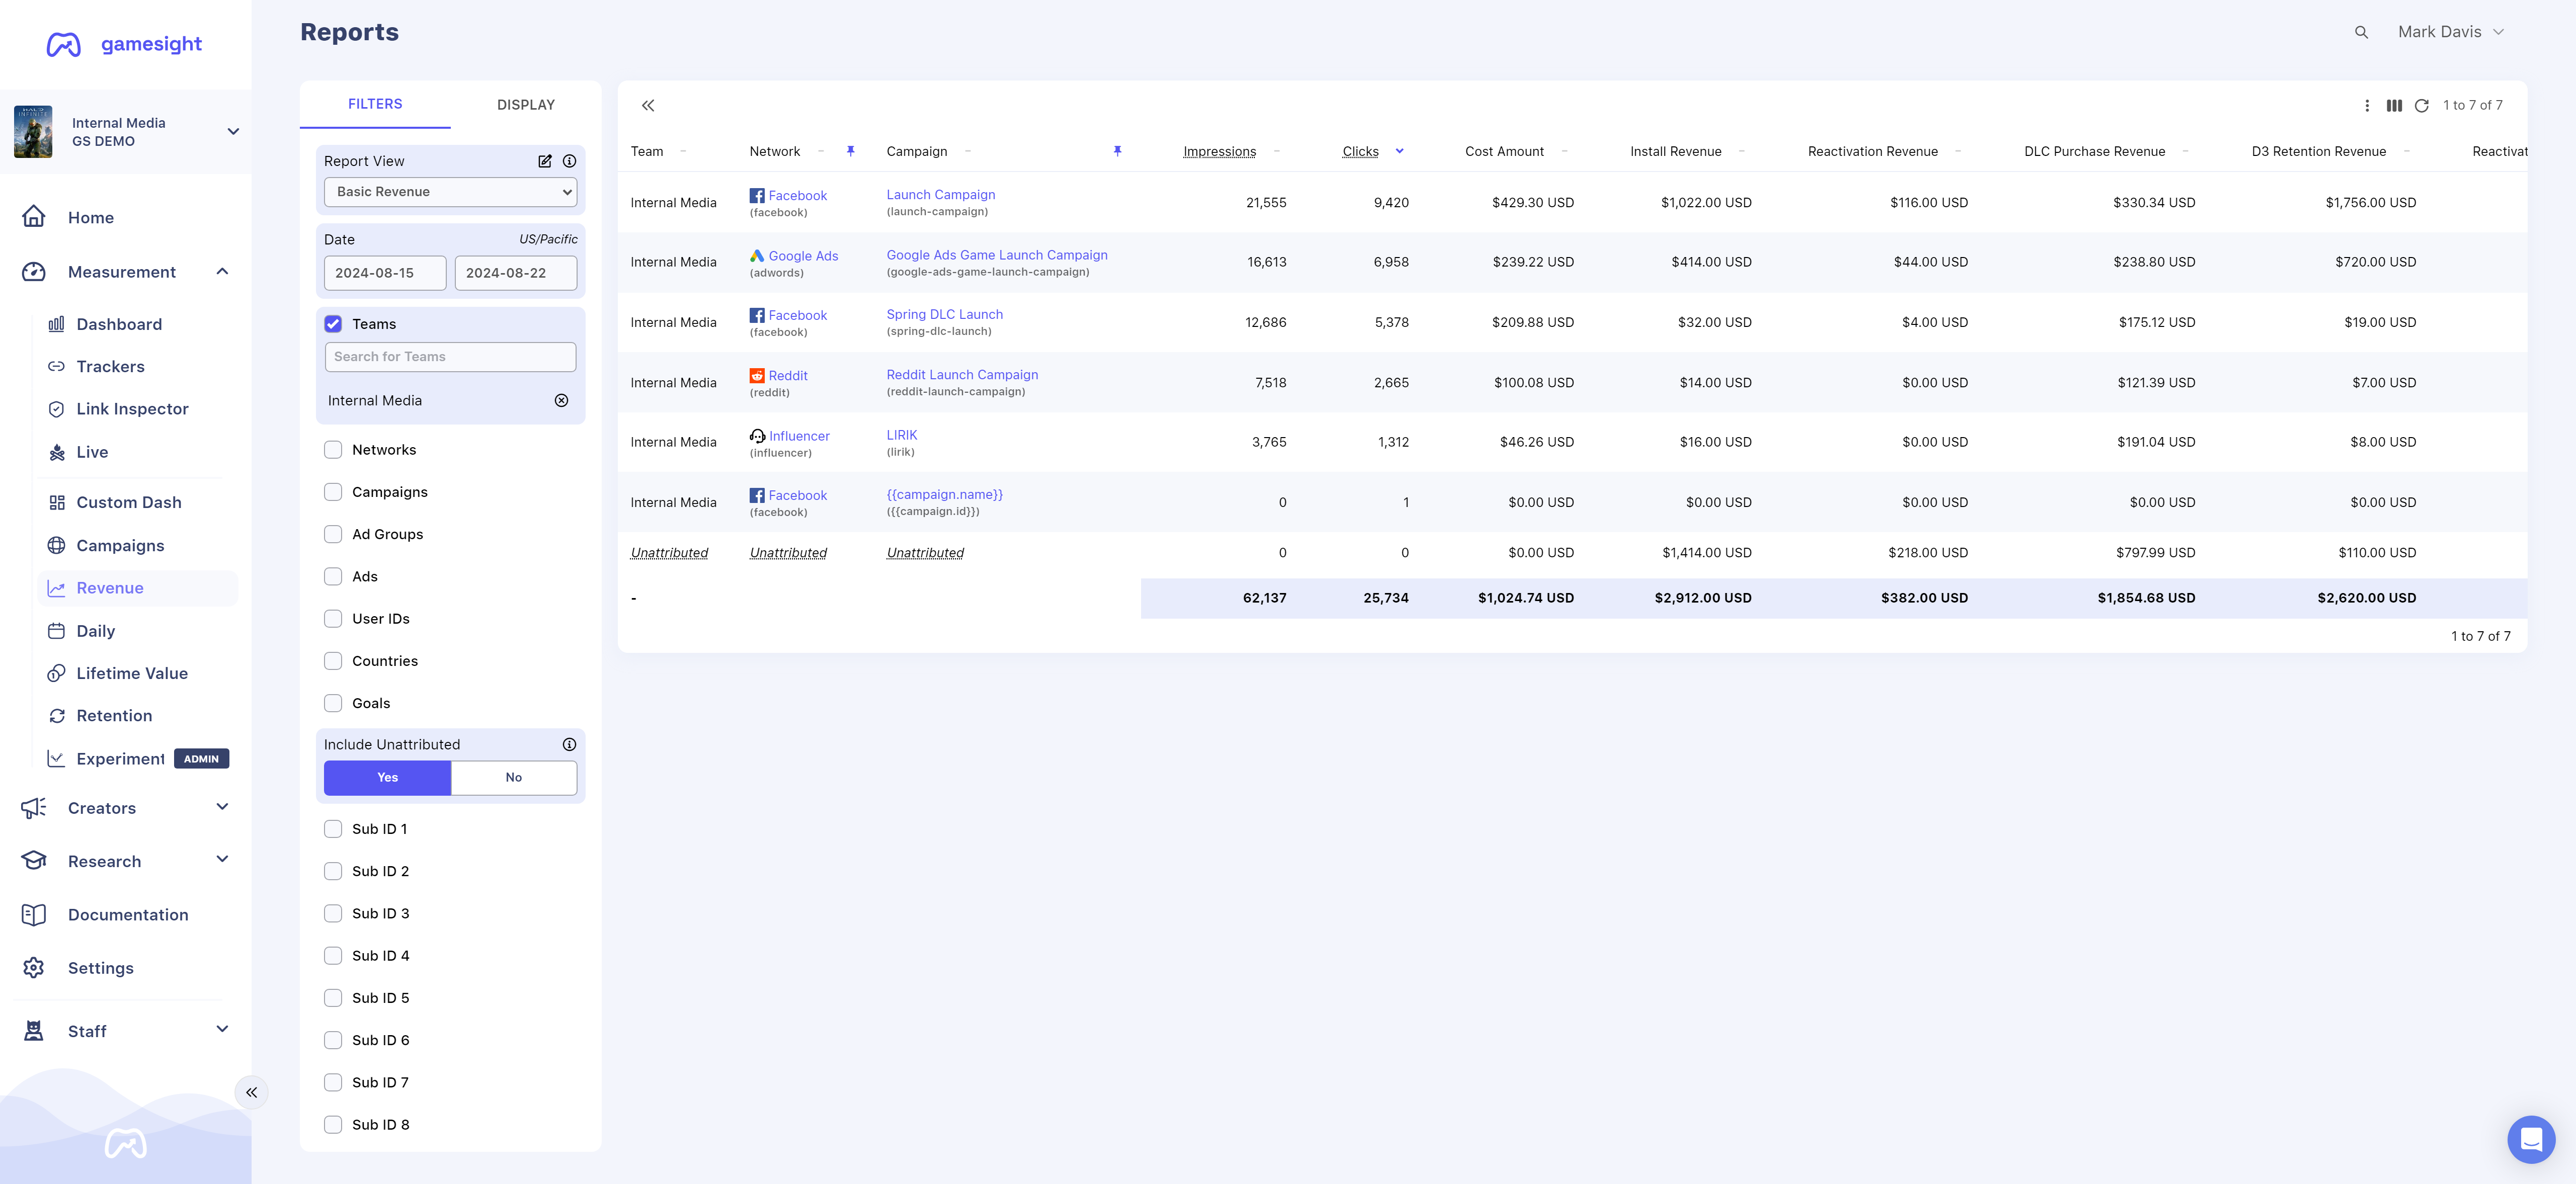
The Revenue report will display all campaigns and their associated costs. This will break down the amount of money you spent on a specific campaign and revenue such as Purchase revenue, DLC purchase revenue, ROAS, etc. during the timeframe you select and the applied reporting filters.
In the image below, we are focusing on the Facebook Ads network and our "Launch" and "Spring DLC Launch" campaigns. A brief look at this report will show that our campaigns performed well since our Purchase and DLC Purchase revenue was significantly higher than the campaign's Cost Amount - resulting in our Return On Advertising Spend (ROAS) being positive.
Daily Report
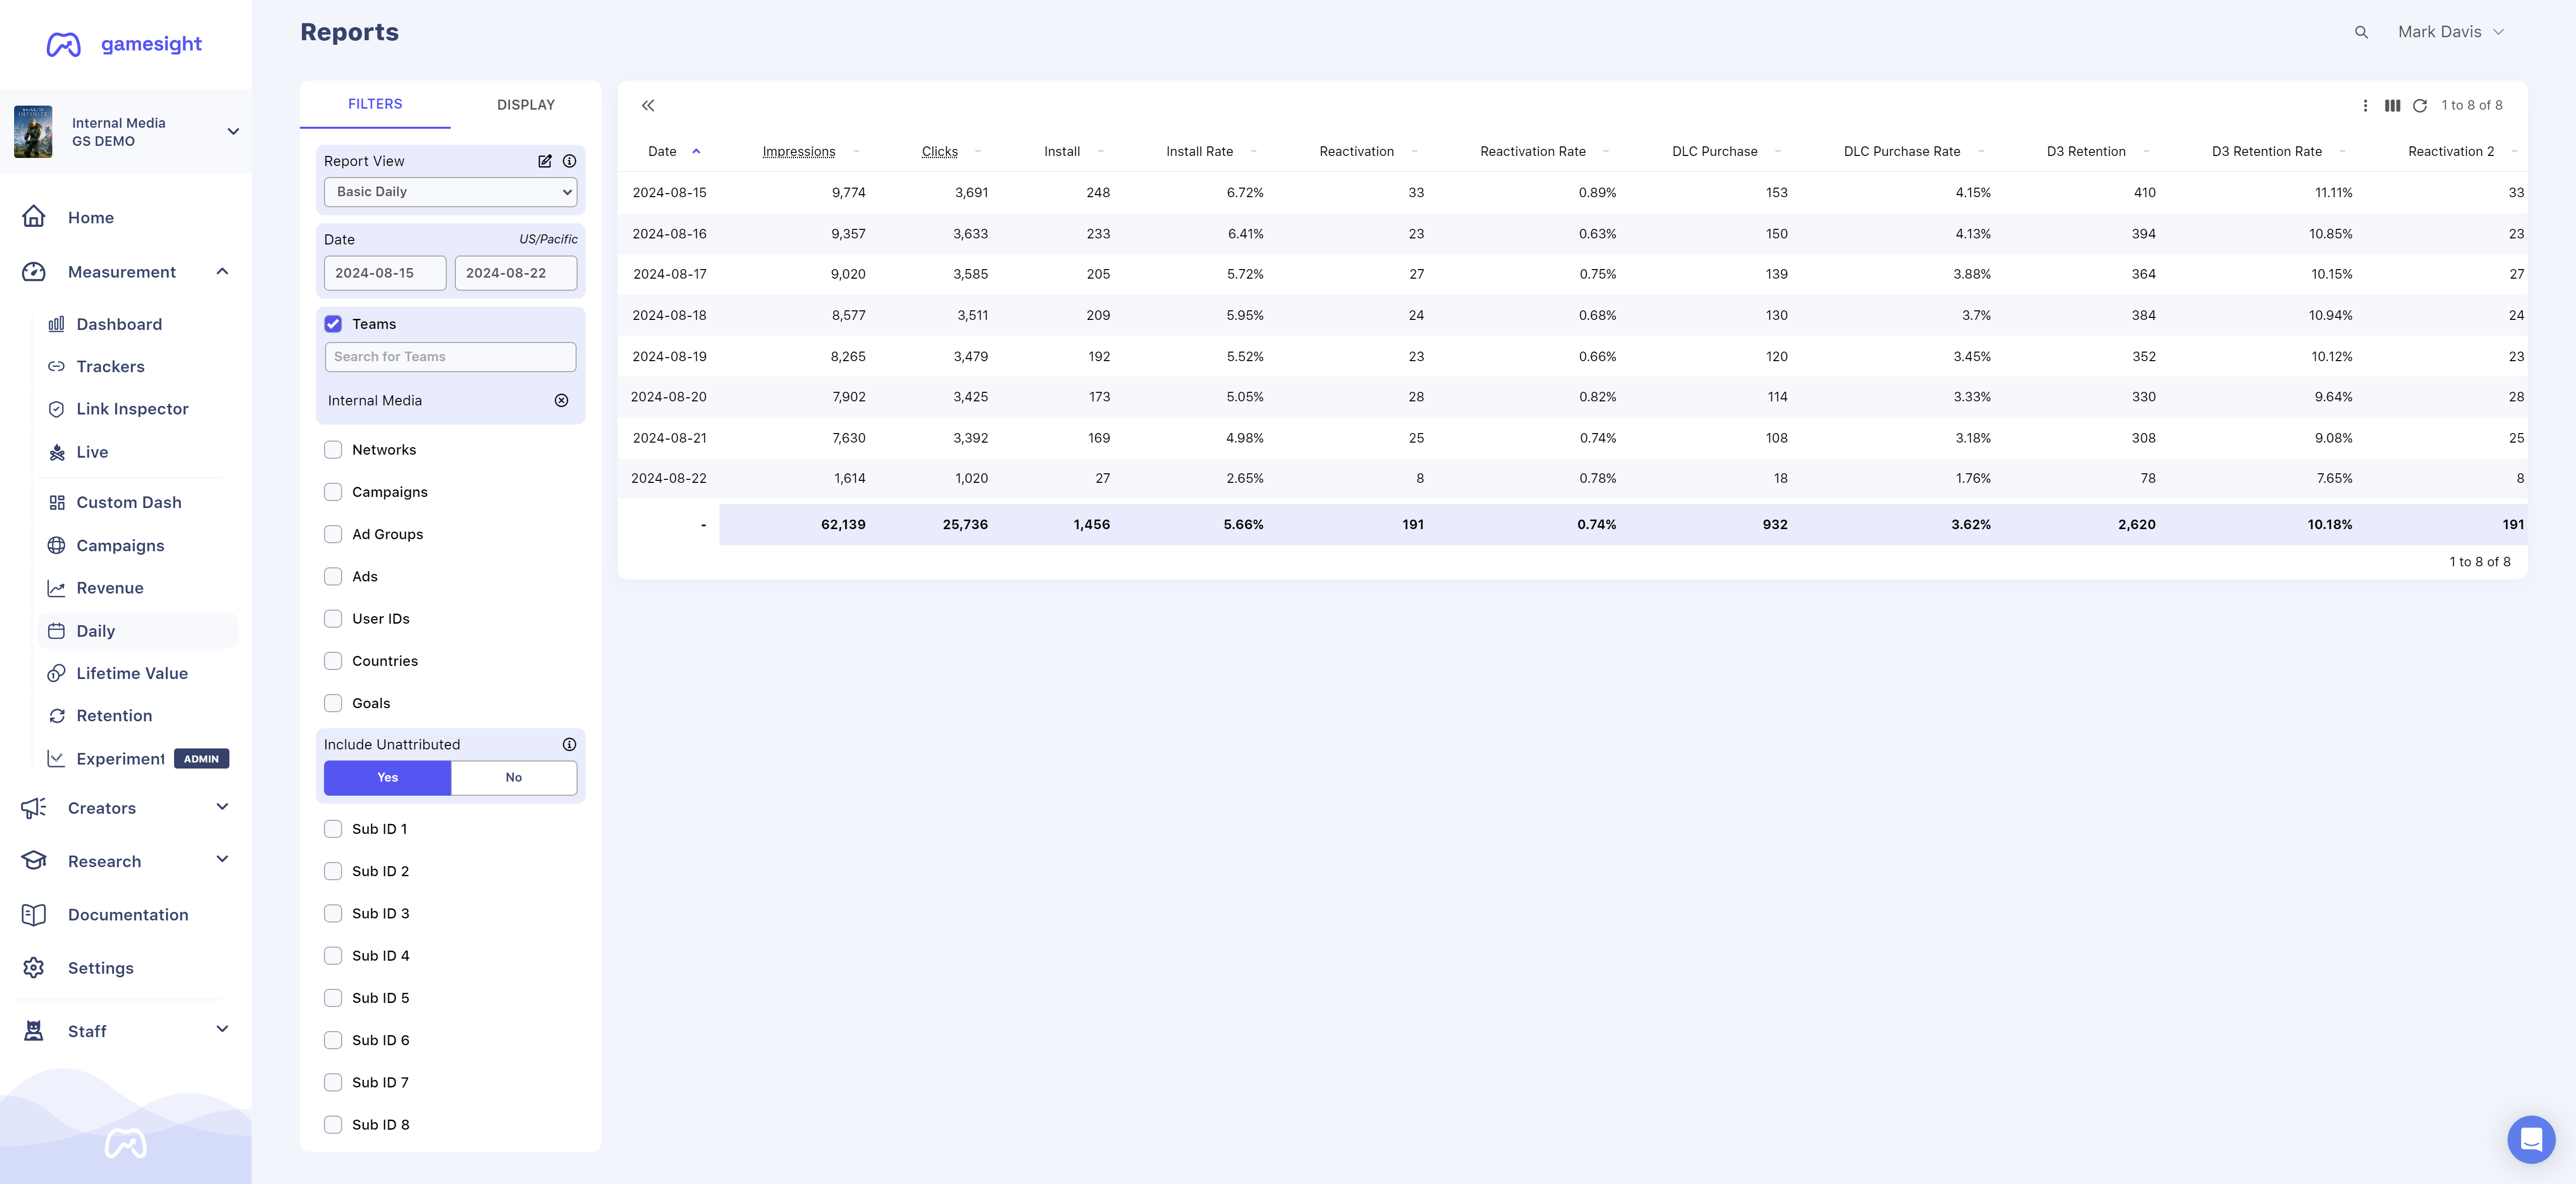
The Daily report will display overall campaign performance broken down daily for the time duration you select and the applied reporting filters. An example Daily Report can be seen in the image below where each day in the 7-day date range is reported separately.
Lifetime Value Report
The Lifetime Value (LTV) report "cohorts" users based on how they were originally acquired/attributed by default. The LTV report will show every purchase (gross revenue) that players attributed to a specific campaign made in total (in-game purchases, DLC, etc.) over their lifetime. The time range settings do not impact the total revenue reported for a specific user, it will always display their lifetime revenue.
Additionally, you have the ability to see Post-Install Events (DLC purchases, Game Launches, etc.) by adding the "Lifetime Count by Goal" option on the Display tab. Viewing post-install events will help answer the question of "Among users that I acquired from X ad network last month, how many total purchases have they made?".
Note that unlike on our other reports, the time range on the LTV report filters by the date that the user interacted with your marketing campaign. So if you want to see the LTV of users that were referred from a specific campaign you would set the time range to the flight dates of that campaign.
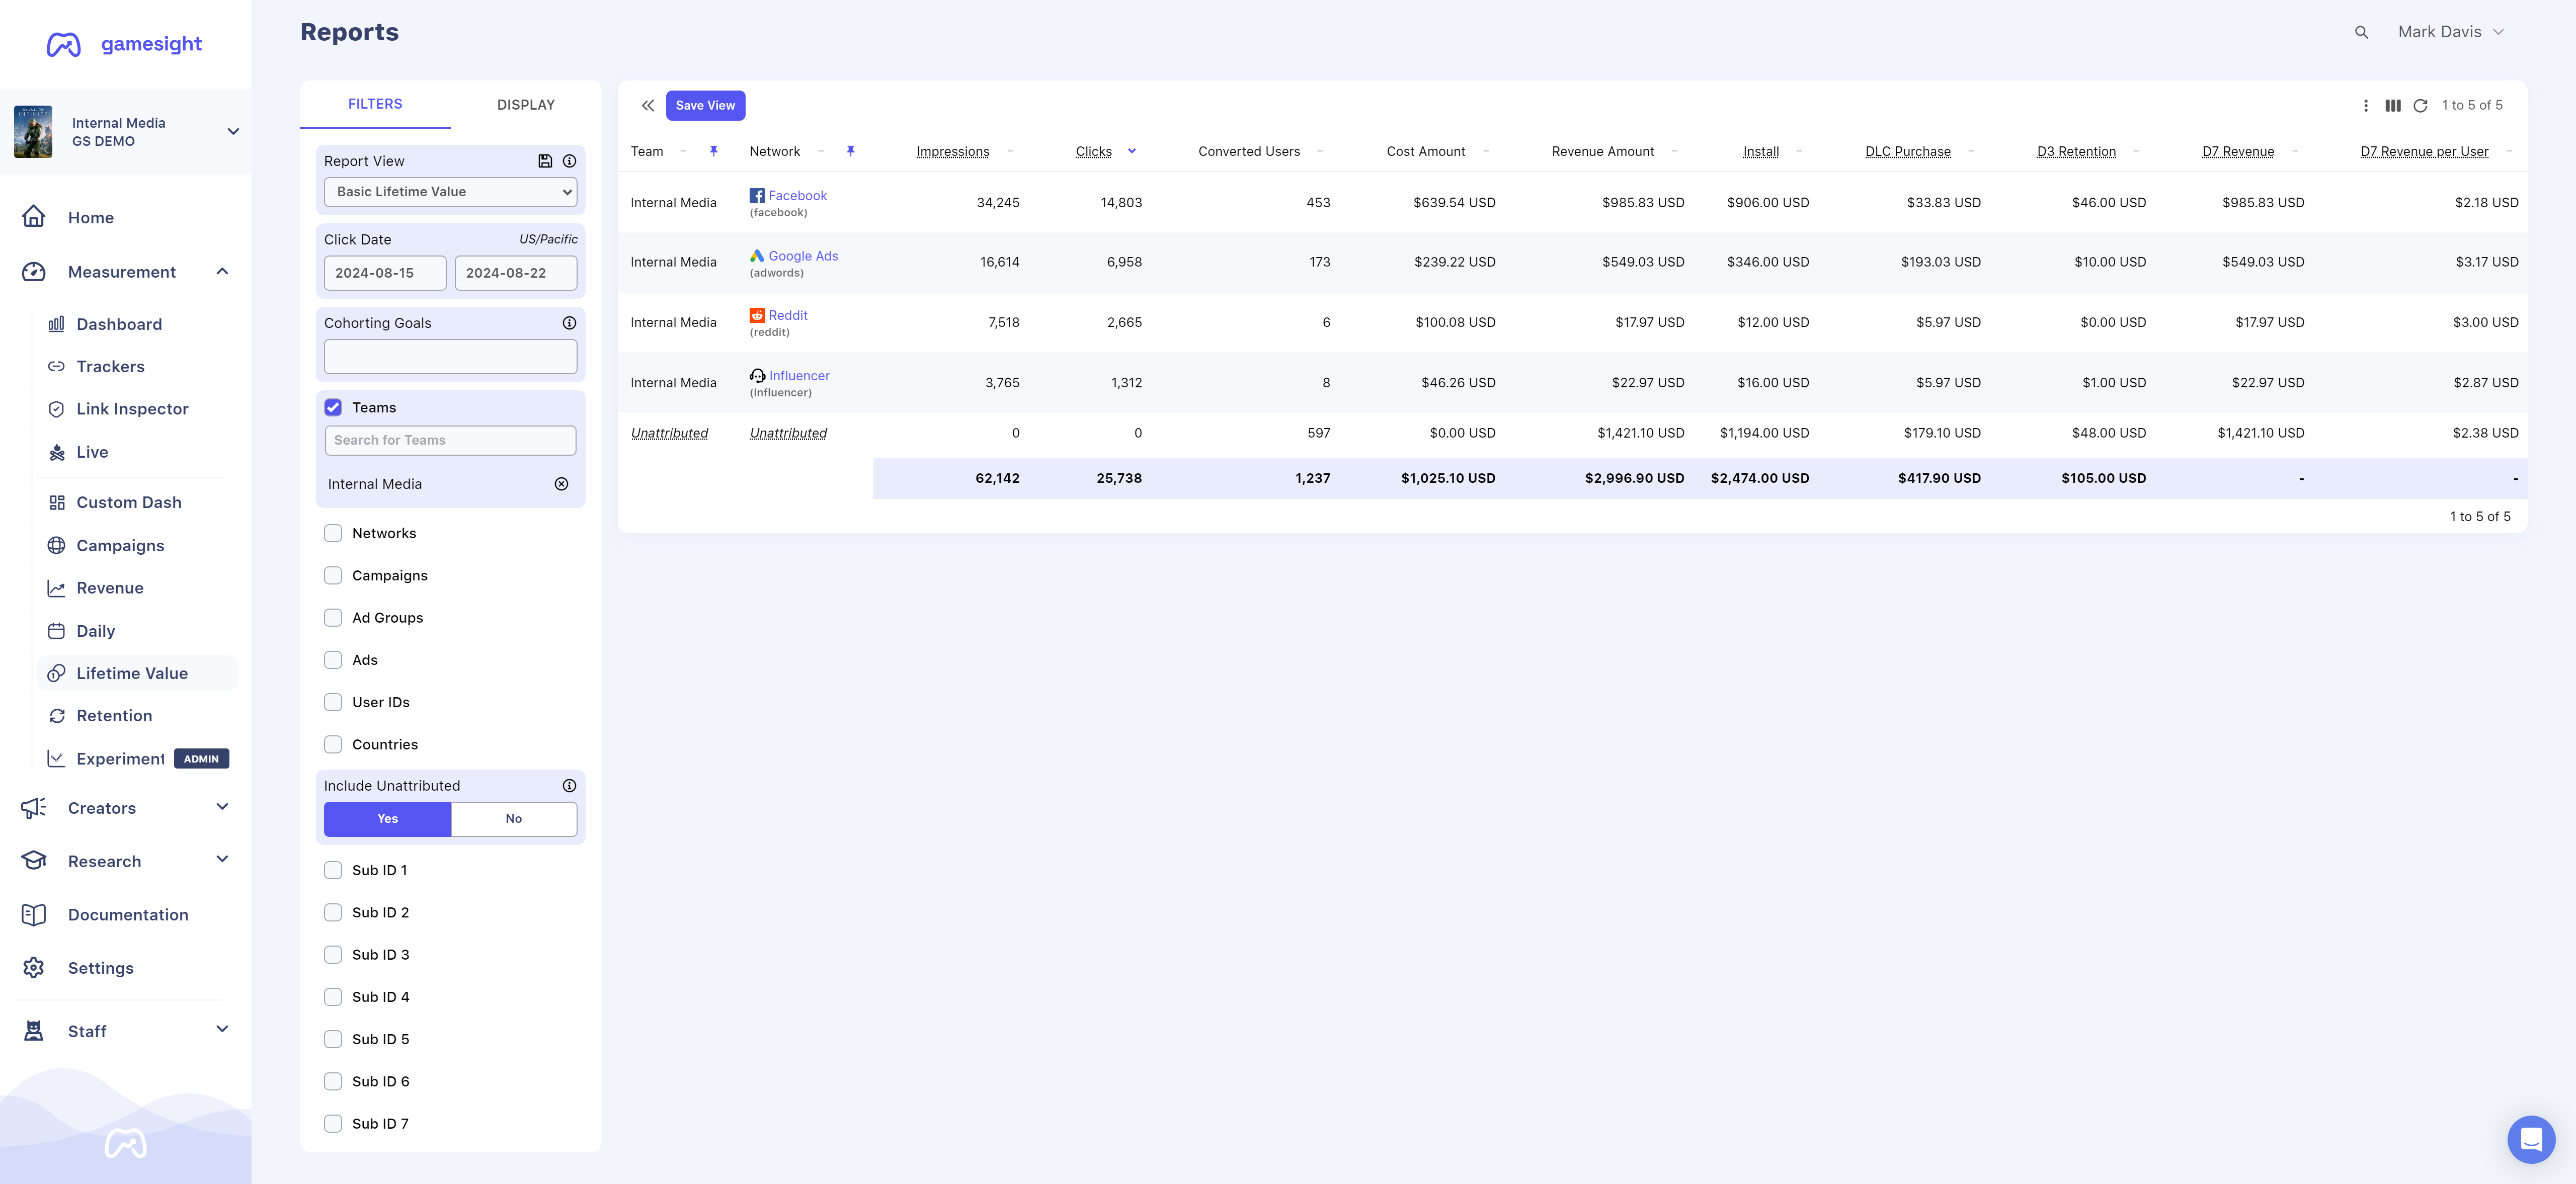
Example LTV report
Retention Report
The Retention report "cohorts" users based on how they were originally acquired/attributed. The Retention report will show both the total volume of retained users as well as the percentage of users retained at D1, D3, D7, D14, and D30. For retention calculations, Gamesight uses rolling retention by default so a user is considered as D14 retained if they have at last 14 days between the first and last time they were seen in-game.
Note that unlike on our other reports, the time range on the Retention report filters by the date that the user interacted with your marketing campaign. So if you want to see the Retention of users that were referred from a specific campaign you would set the time range to the flight dates of that campaign.
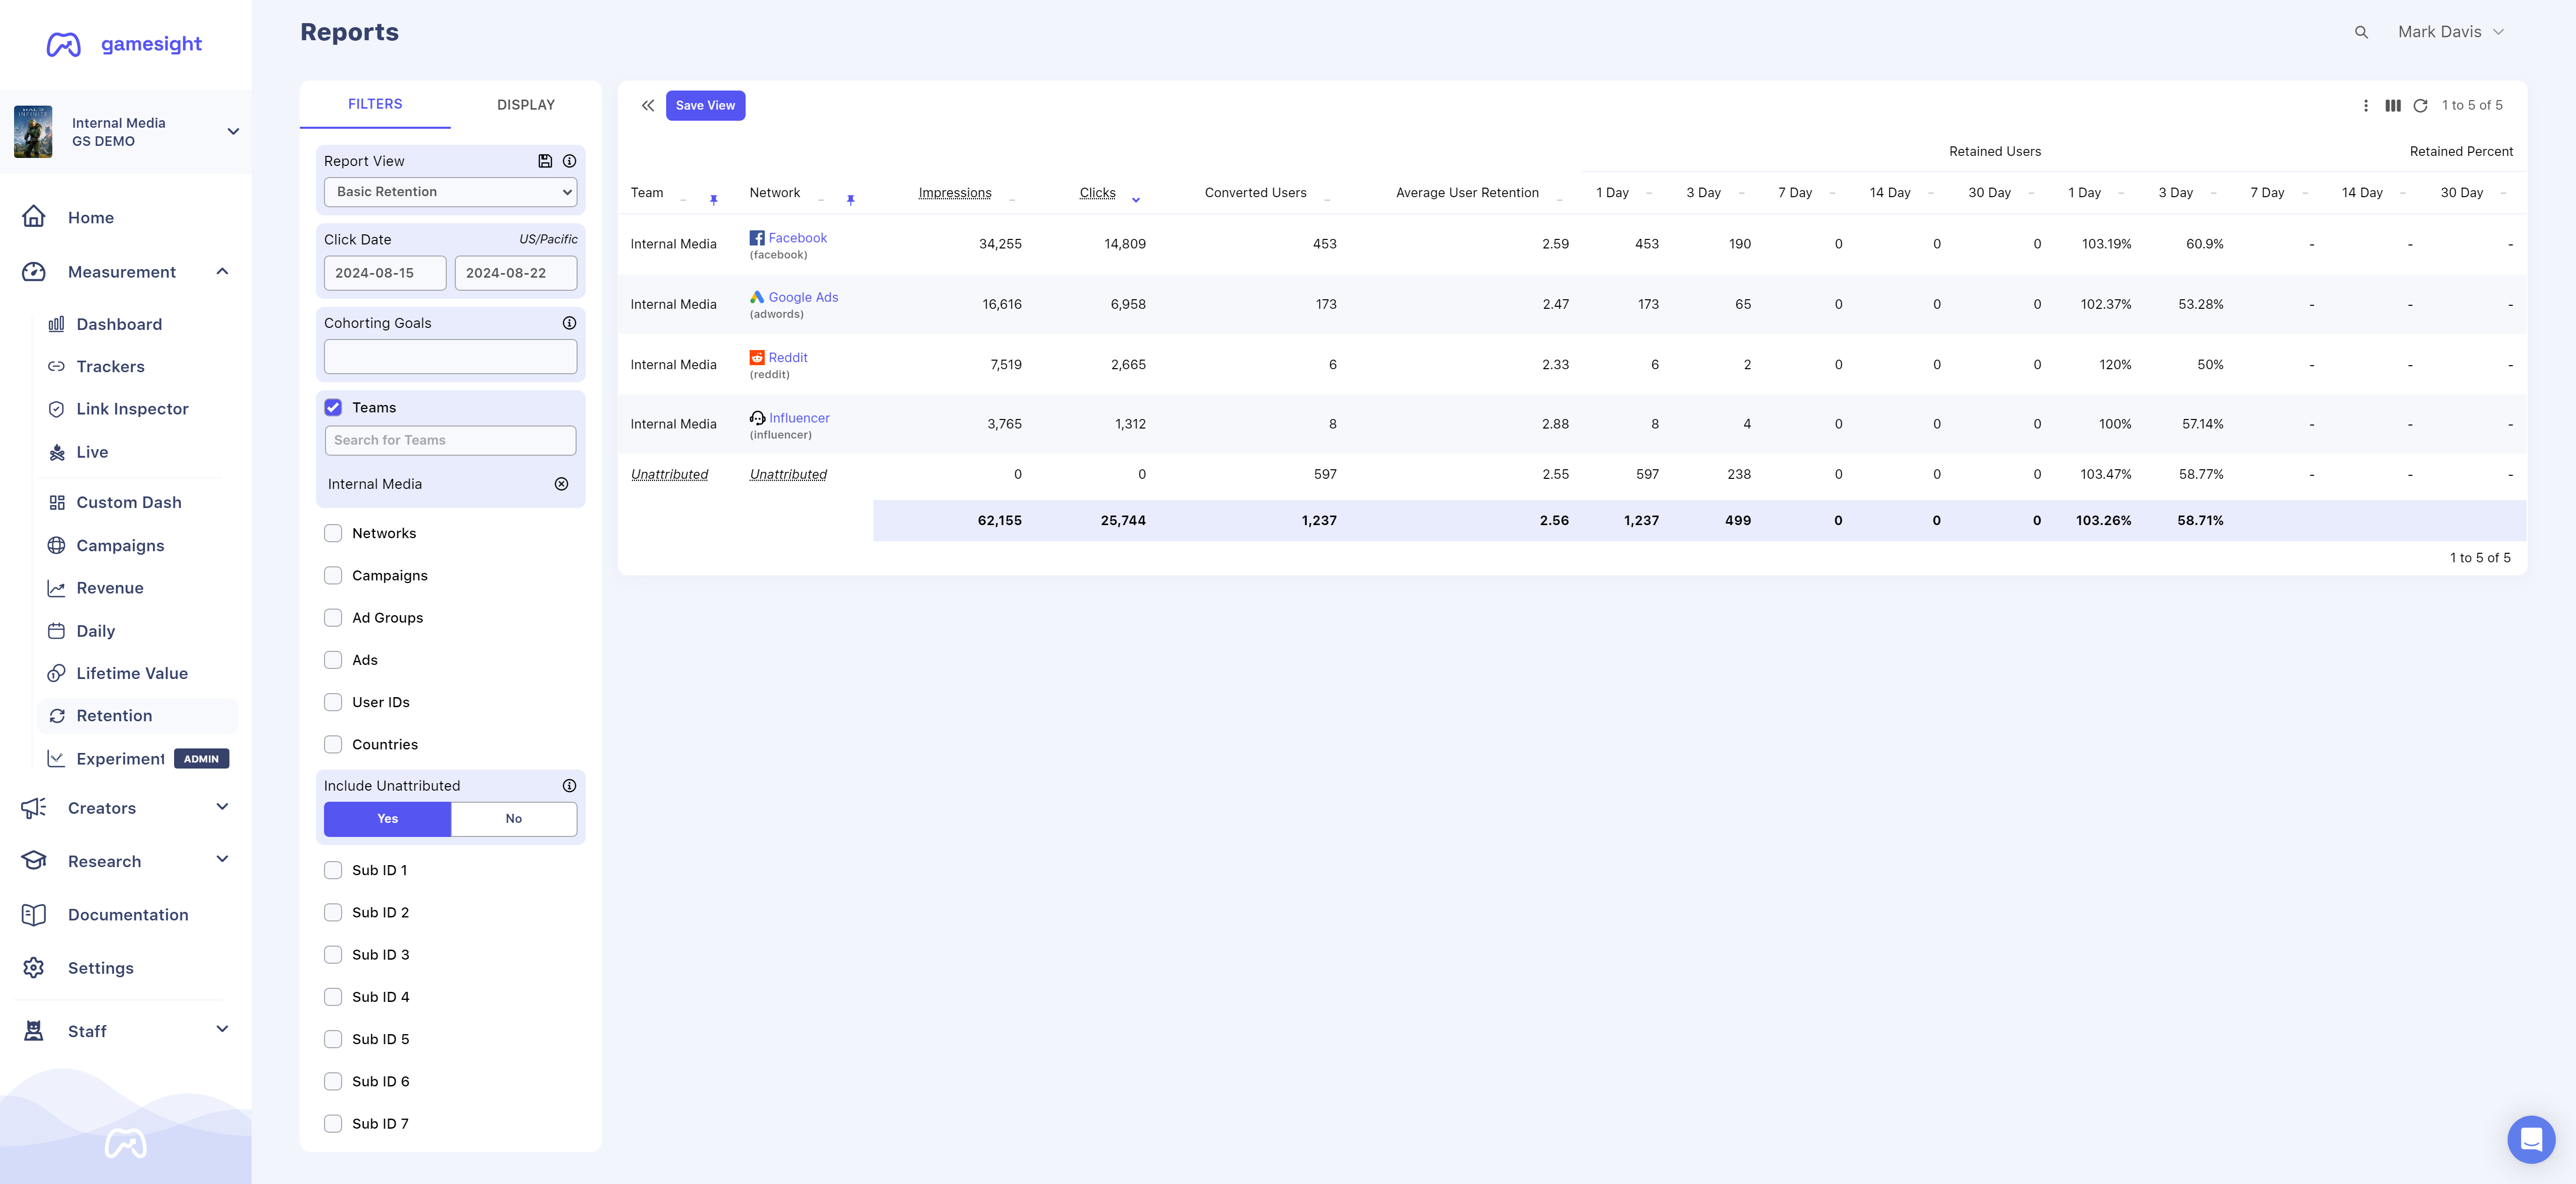
Example Retention report
Touchpoint Time Report
Our core Campaign, Revenue, and Daily reports are based on "action time" meaning that if you pull a report for Jan 1 it will show all touchpoints and goals that were triggered on Jan 1. The Touchpoint Time Report instead cohorts data by the time of Touchpoint. For example, if you have the following interaction pattern for a user:
- Jan 1 - Google Ads Click
- Jan 2 - Install Goal
In the Touchpoint Time Report would show the Install based on the time of the user's click. So a report covering Jan 1 would include this Install. This can be useful in cases where you are looking to see how the campaign performance may be evolving over time, enabling you to look at and compare each cohort of users based on the time that they were exposed to your ad.
Custom Reports
In addition to our built-in reports, you can create your own custom reports to meet the specific reporting needs of your team.
- Sharing Reports - Each report gets a unique link which makes it easy to return to a specific report or share with your team mates.
- Scheduled Reporting - Reports can be configured to send emails with the report attached as a CSV at a cadence of your choosing to one or more recipients. This can greatly ease collaboration with ad partners that would like regular updates on their campaign performance.
- Team Specific - Custom reports are associated with a single Team enabling your various regional teams or ad partners to manage their own set of reports based on their needs.
Create New Report
To create a new report, navigate to the Reports page and press the Create Report button.
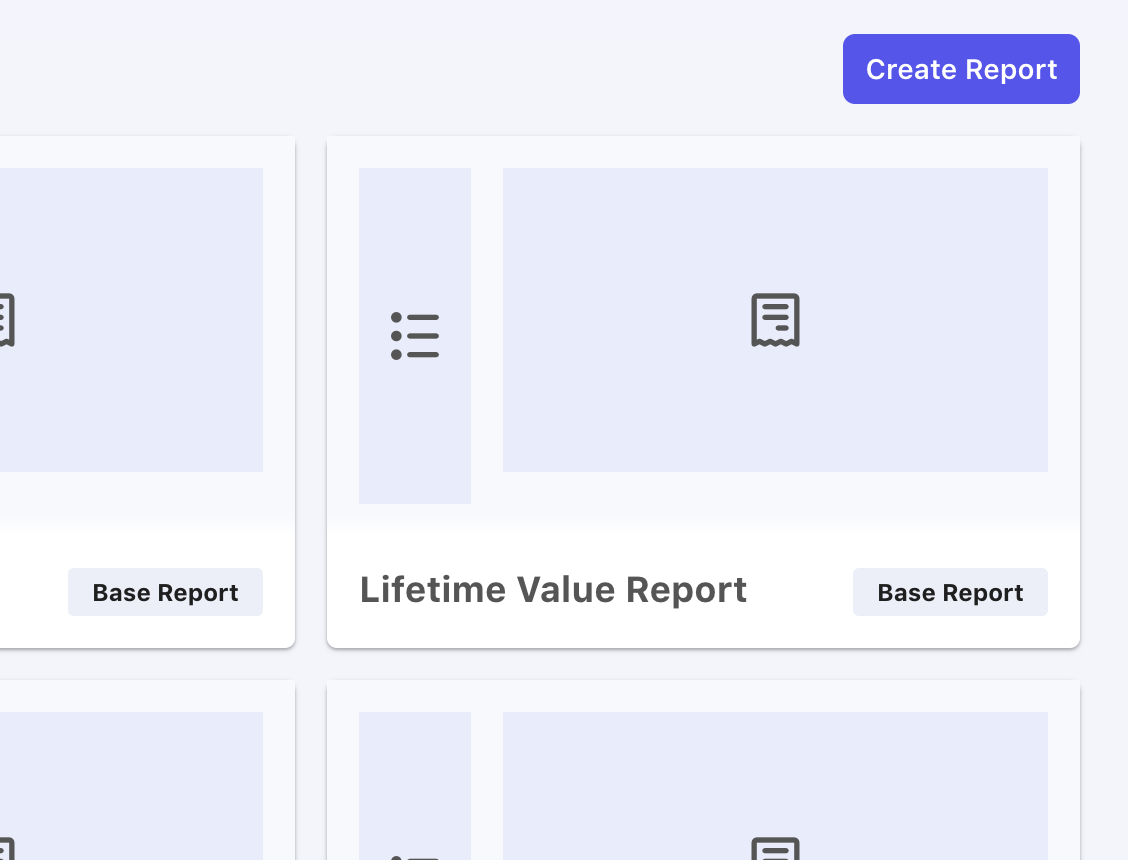
From here you will be presented with options to select a base report that you want to start as a template for your new report.
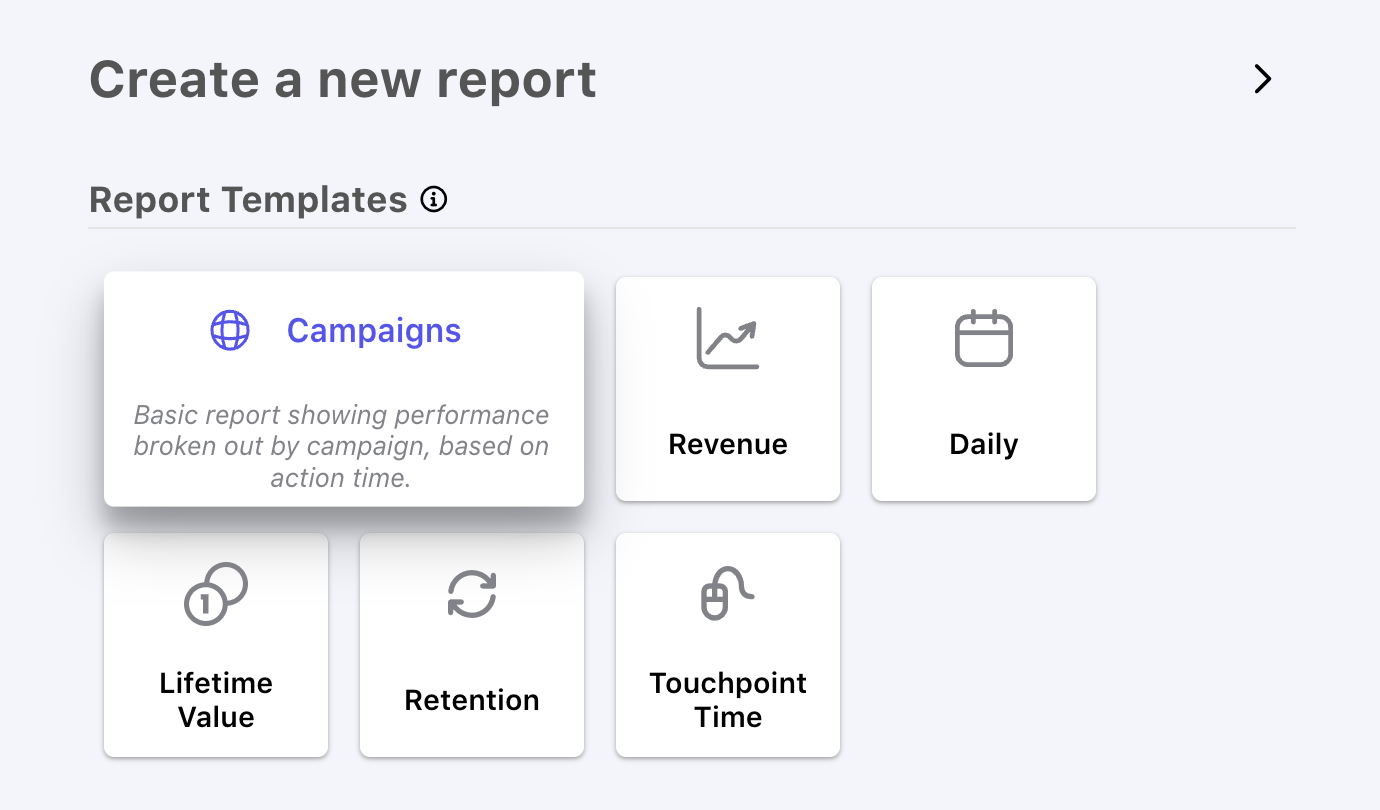
Select report template
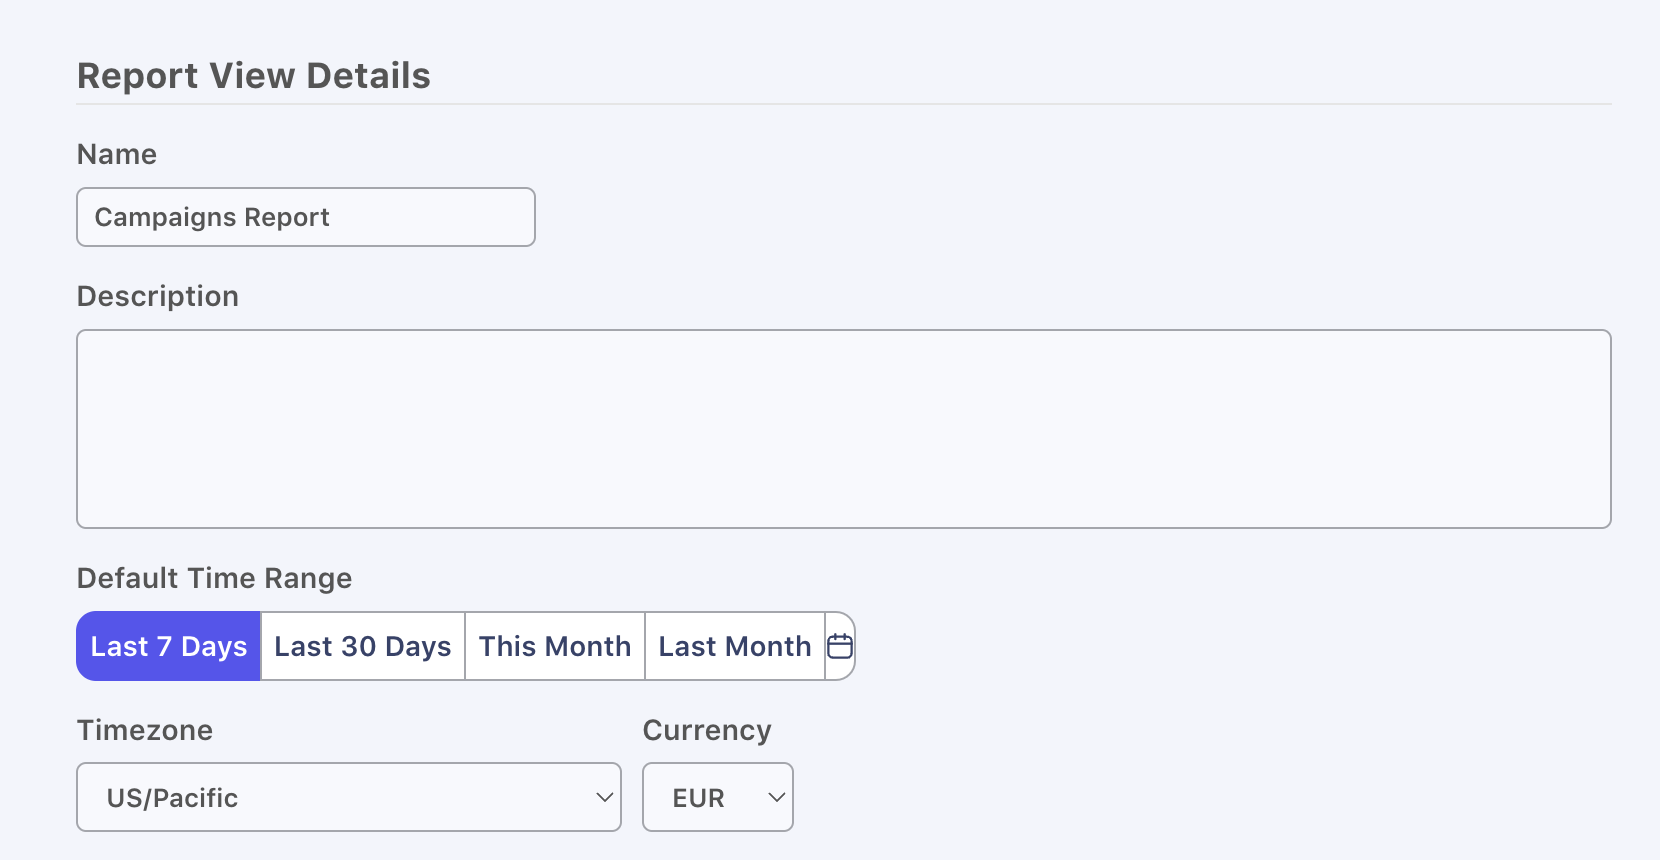
Now you can set a Name for your report, add an optional Description, choose your Default Time Range and click Save!
Create from Existing
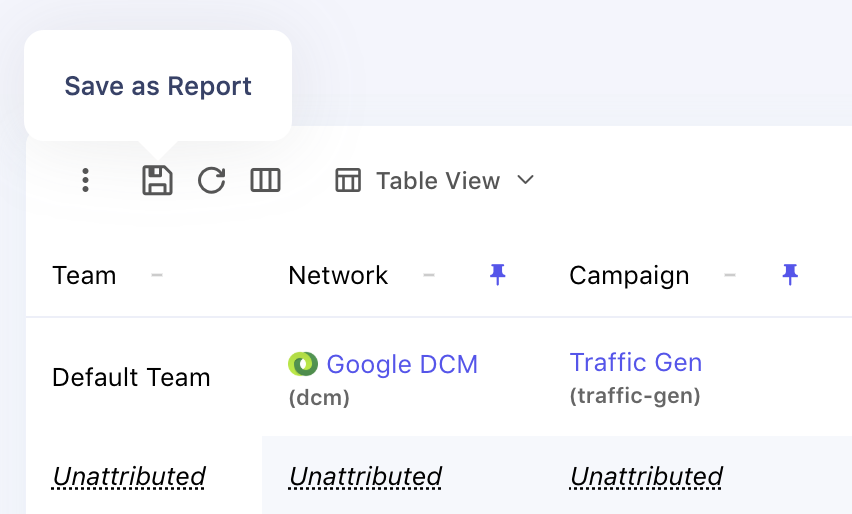
It is also possible to create a new report directly from an existing Base Report page. After you have customized the Base Report you can press the "Save as Report" button to create a new report with your current settings.
Managing Reports
To Edit an existing report, start by navigating to the report you which to modify. When you made changes to an existing report you will see a red indicator appear on the report's save icon. Pressing this will save your modifications to the report for future use.
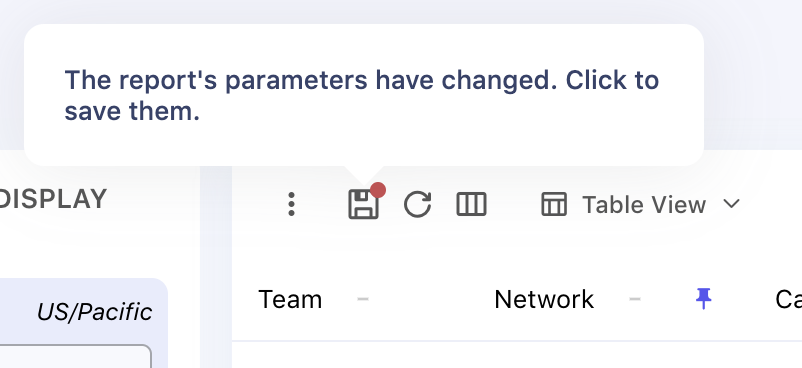
You may use the Save option to change values like name, description, and Scheduled Reporting configuration as well.
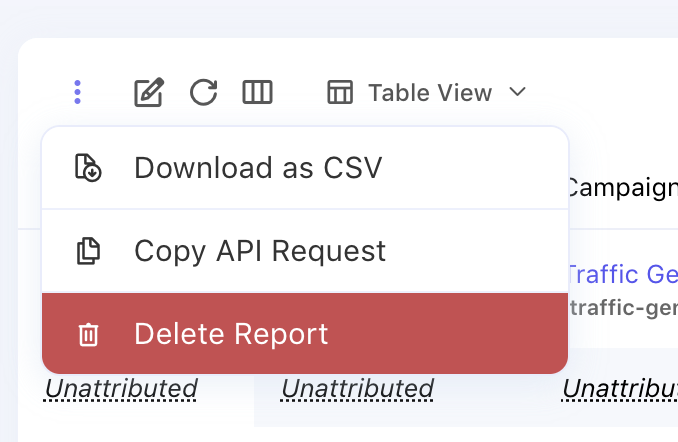
To Delete an existing report, click the ellipsis ("⋮") at the top of the reporting page of your choice and click the "Delete Report" option.
Working with Reports
The report tables contain a number of features that allow you to cohort, filter, and customize your reports to your specific needs.
Display Mode
Reports can be toggled between several display modes to allow you to quickly visualize your data in several ways:
- Table - the standard report table giving you detailed view of your reporting information
- Line Chart - an automatic time series view of the data in your report and will show your report at a daily resolution by default.
- Pie Chart - creates a pie chart from the data in your report, often useful when comparing the percent distribution of a metric between cohorts

If you have selected a Chart View, you will see an additional "Chart" tab on your configuration panel which allows you to manage the settings for your chart including which metric is charted and the dimensionality of the data.
Groups
Groups control the dimension of your report. For example, breaking down reports by campaign, date, country, or creative. To adjust the groups for your report, navigate to the Display tab and check the corresponding boxes next to the Groups that you would like to include in your report.
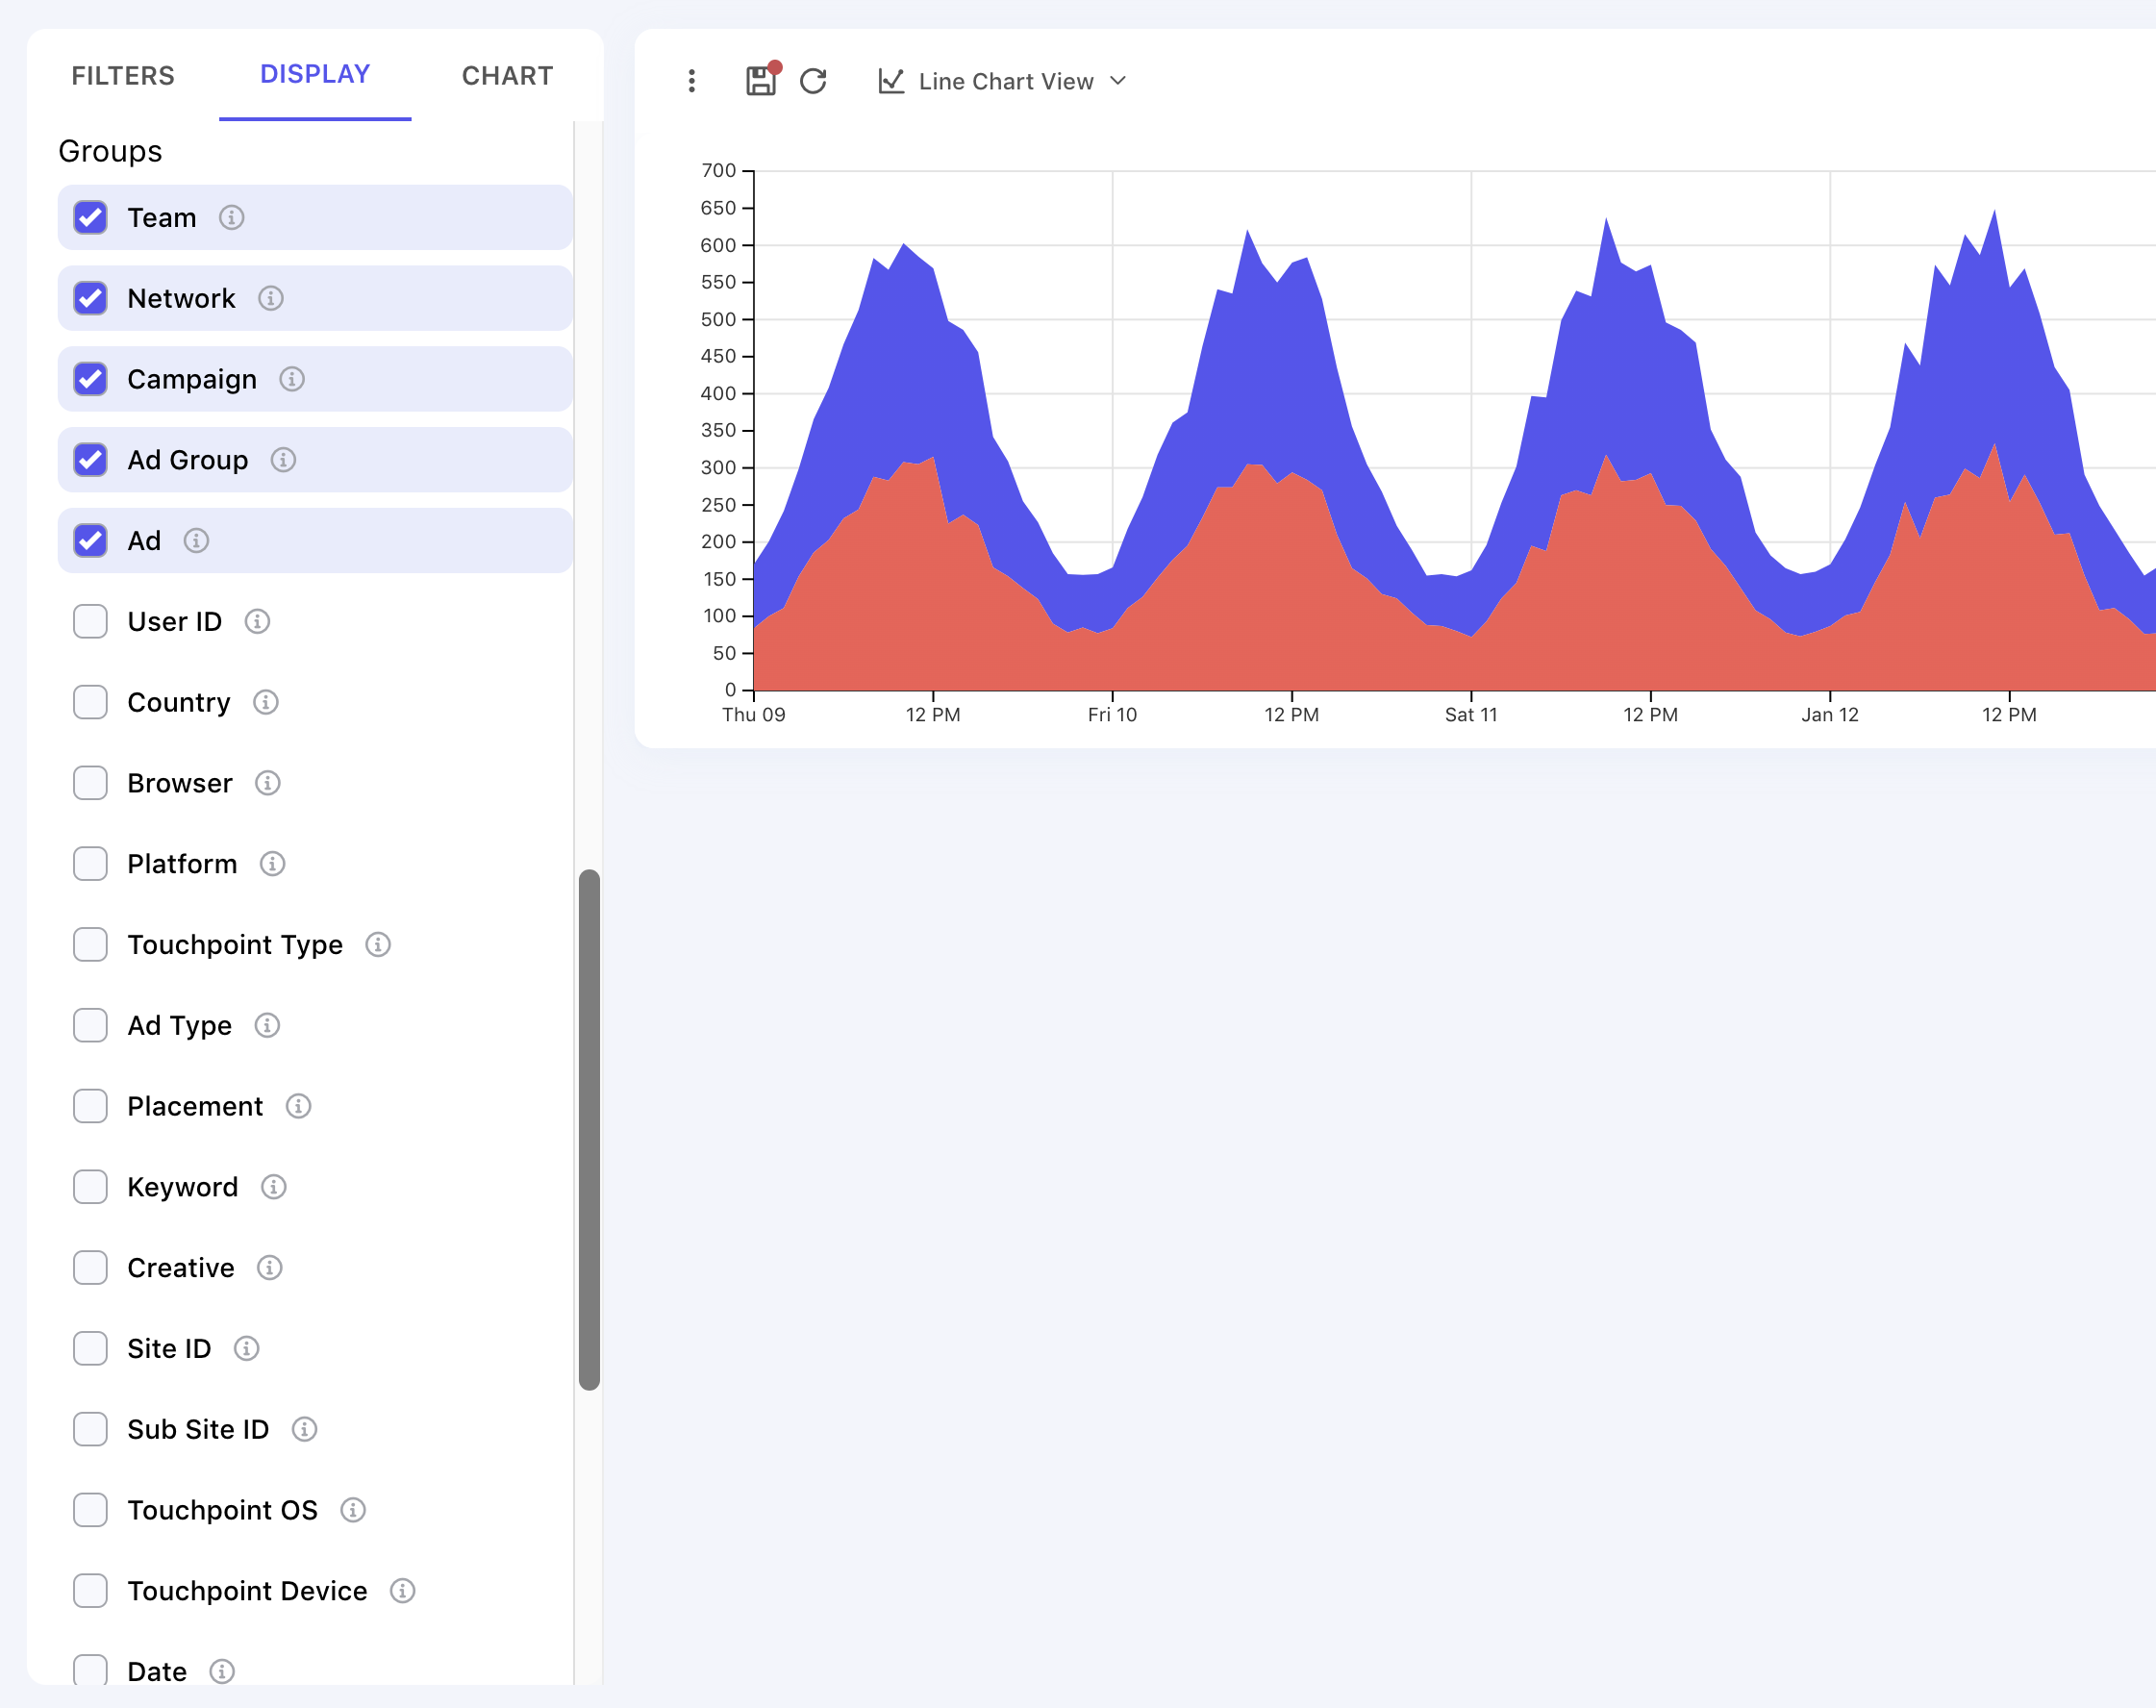
Example Group option listing
You can find additional information about each available dimension by hovering over the information icon next to the field name.
For example, if you would like to view the Platforms that events are occurring on, you can enable "Platform" on the Display tab. Enabling the Platform to show up in your reports will now show where the events are happening (Xbox, PS, EGS, Switch, Steam, etc.).
Metrics
Metrics are the values which are included in the report (impressions, clicks, installs, cost, etc). These can be managed on the Display tab alongside the groups as outlined above. You can find a detailed description of each available metric either through the tooltips on the page or at the Reporting Metrics guide.
Filters
Using Filters, you can break your report down to focus on only the information that is important to you. For example, you can focus on a single ad network, a single ad group and an individual ad within that group. You can view attribution data for specific Countries, view or exclude Unattributed Goals/Events (organic lift) and more.
Reordering Columns
You can reorder the columns in your reports simply by dragging the headers to your desired order. This can be helpful to help better understand your funnel when you have many goals configured for your Game and would like to see a specific flow at a glance. Additionally, by clicking on the X on the header you can hide specific columns from your report to build a very customized view.
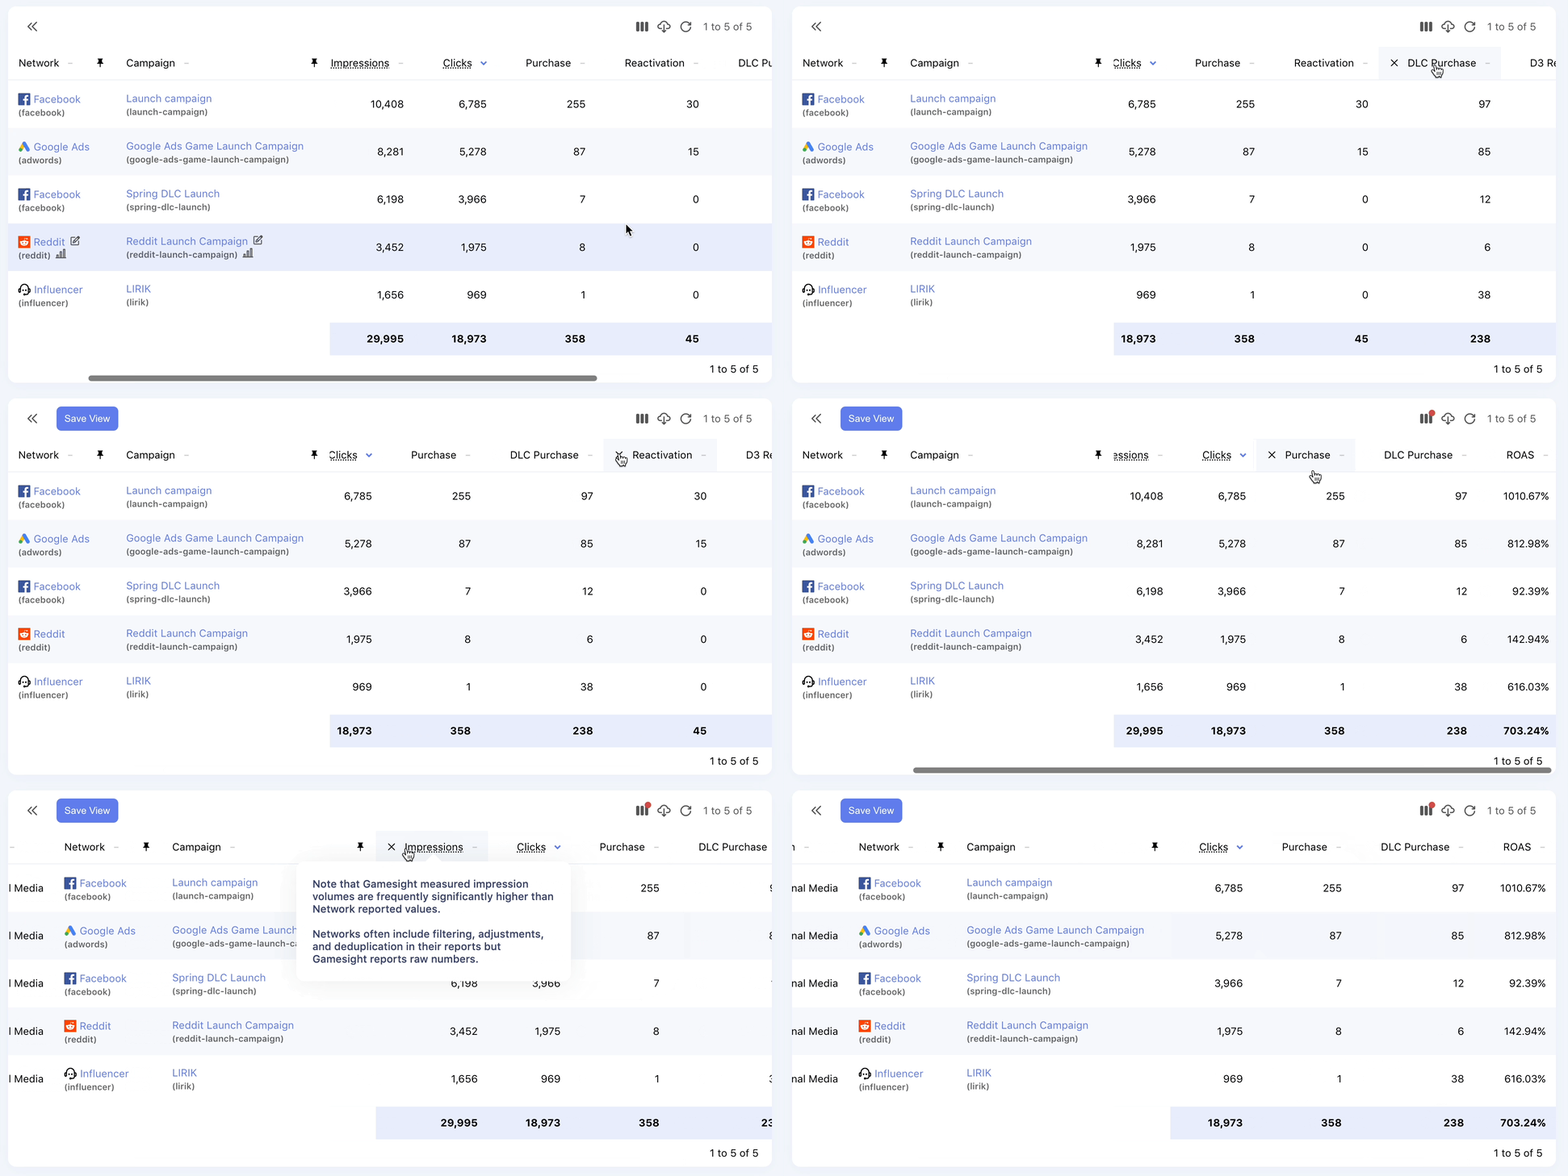
Example of column reordering and hiding
If a report has hidden columns, you will see a red indicator icon on the column list (three column icon in the report header). Clicking this icon will show you any hidden columns and enable you to add them back to the report.
Customizing Cohorts
By default, cohorted reports such as the LTV and Retention reports will create cohorts based on the original acquisition source of a user (e.g. how their Install goal was attributed). Gamesight reports also enable you to customize this cohorting logic to view your user acquisition cohorts based on any goal (or combination of goals) that you have configured.
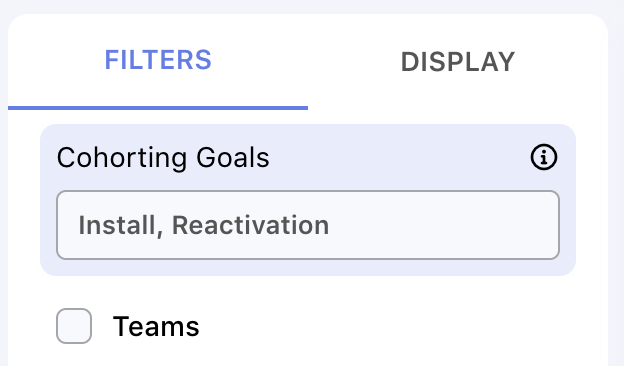
Cohort configuration option
When you select multiple goals as your "Cohorting Goals" on a report, each user's cohort will be reset each time they trigger one of the provided goals. For example, it is common to utilize both Install & Reactivation together to view LTV or Retention data for both newly acquired and reactivated users together when calculating the impact of a marketing channel.
Saving to Dashboard
Create personalized views of your most important metrics by saving reports and charts directly to custom dashboards, giving your entire team instant access to critical performance data and trends.
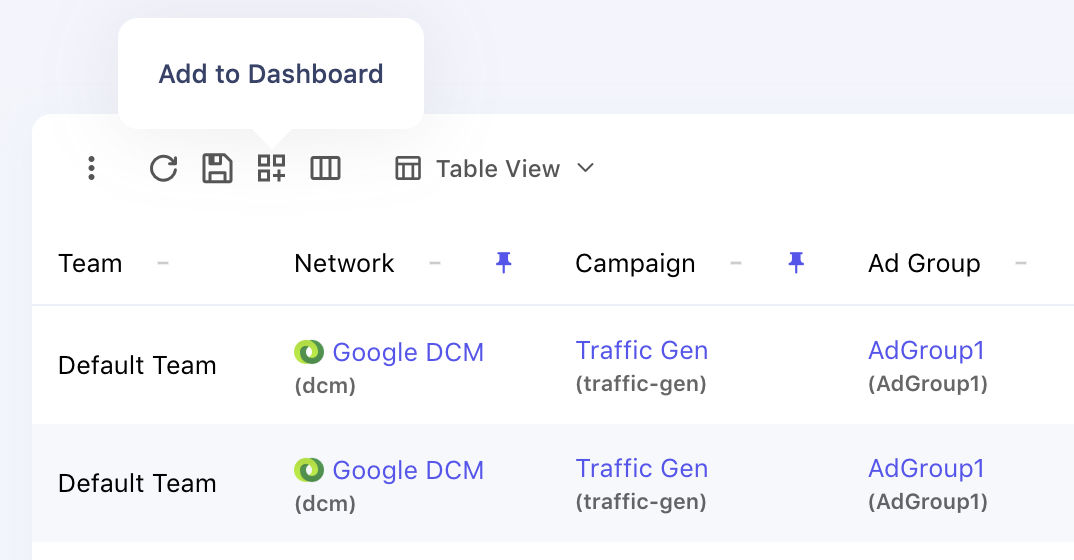
Save to Dashboard button
Learn more about the custom dashboard features on the Custom Dashboards guide.
Metric Search
Quickly locate specific metrics by using the built-in search functionality:
- Type any metric name or keyword to filter the available options
- Search works across all metric categories
- Results update in real-time as you type
Collapsible Metric Groups
Metrics are now organized into logical groups that can be expanded or collapsed for easier navigation:
- Toggle entire categories on/off with a single click
- Focus on relevant metric types by collapsing others
- Quickly scan available metrics within each category
Advanced Usage
Timezone and Currency Settings
You can quickly and easily set your preferred reporting Timezone and Currency settings in Gamesight directly through your dashboard on the Management page. This will automatically convert all of the reporting dates/times and currencies shown in your reporting to the Timezone and/or Currency options that you chose.
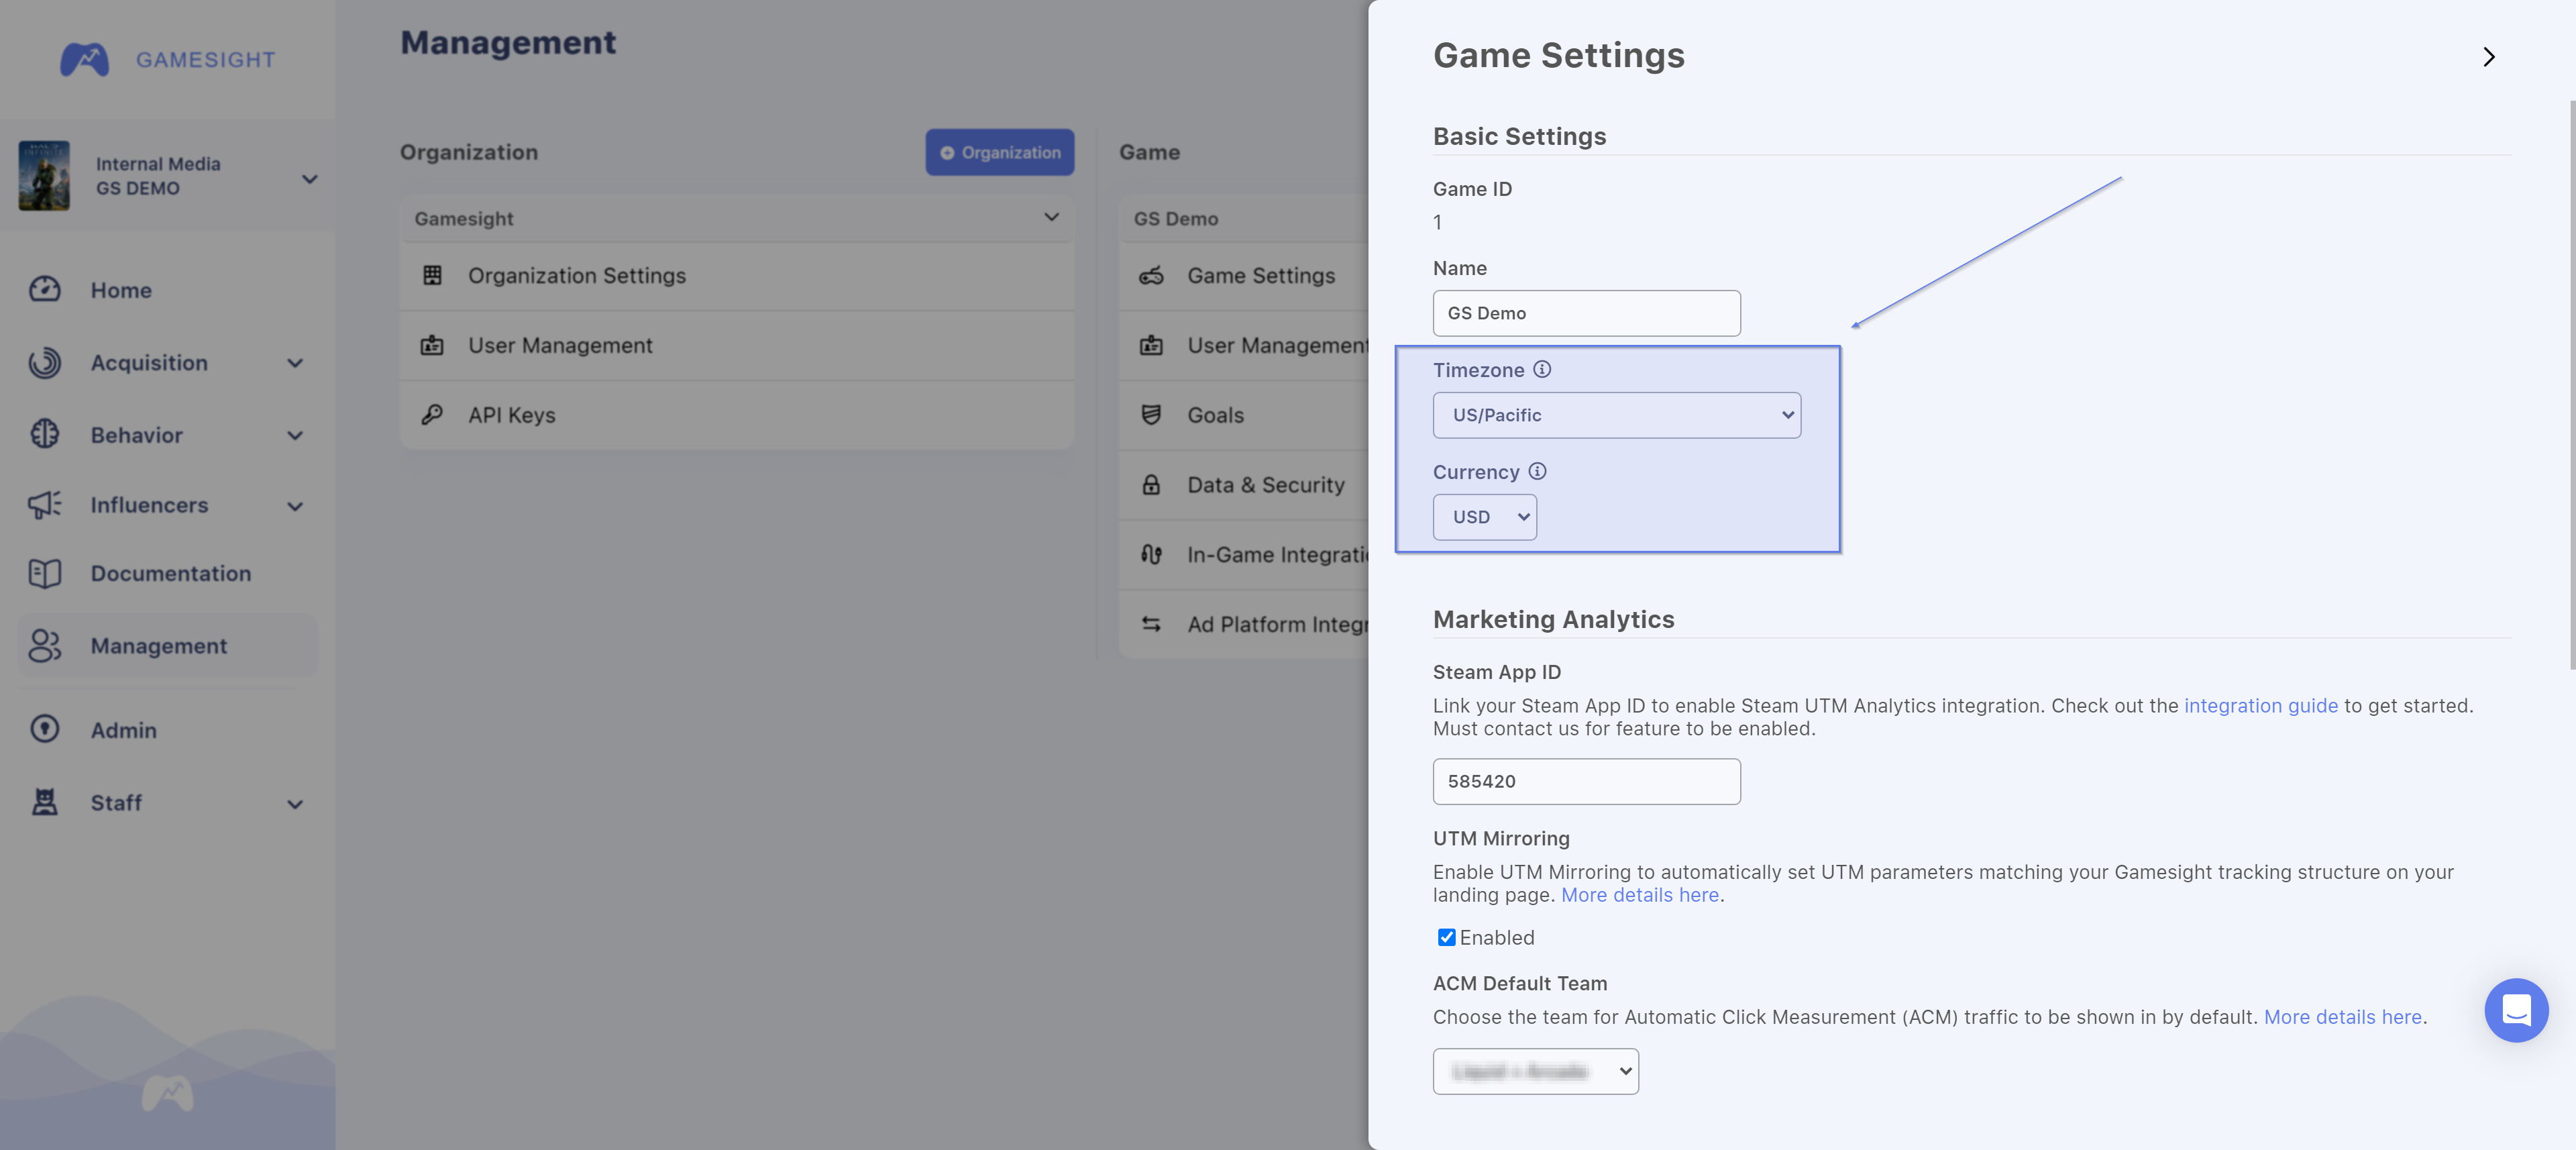
You can also change the Timezone directly on reporting pages, such as the Campaigns Report, as shown below. This flexibility will allow you to export reports in the Timezone of your choice.
Simply click directly on the displayed Timezone:
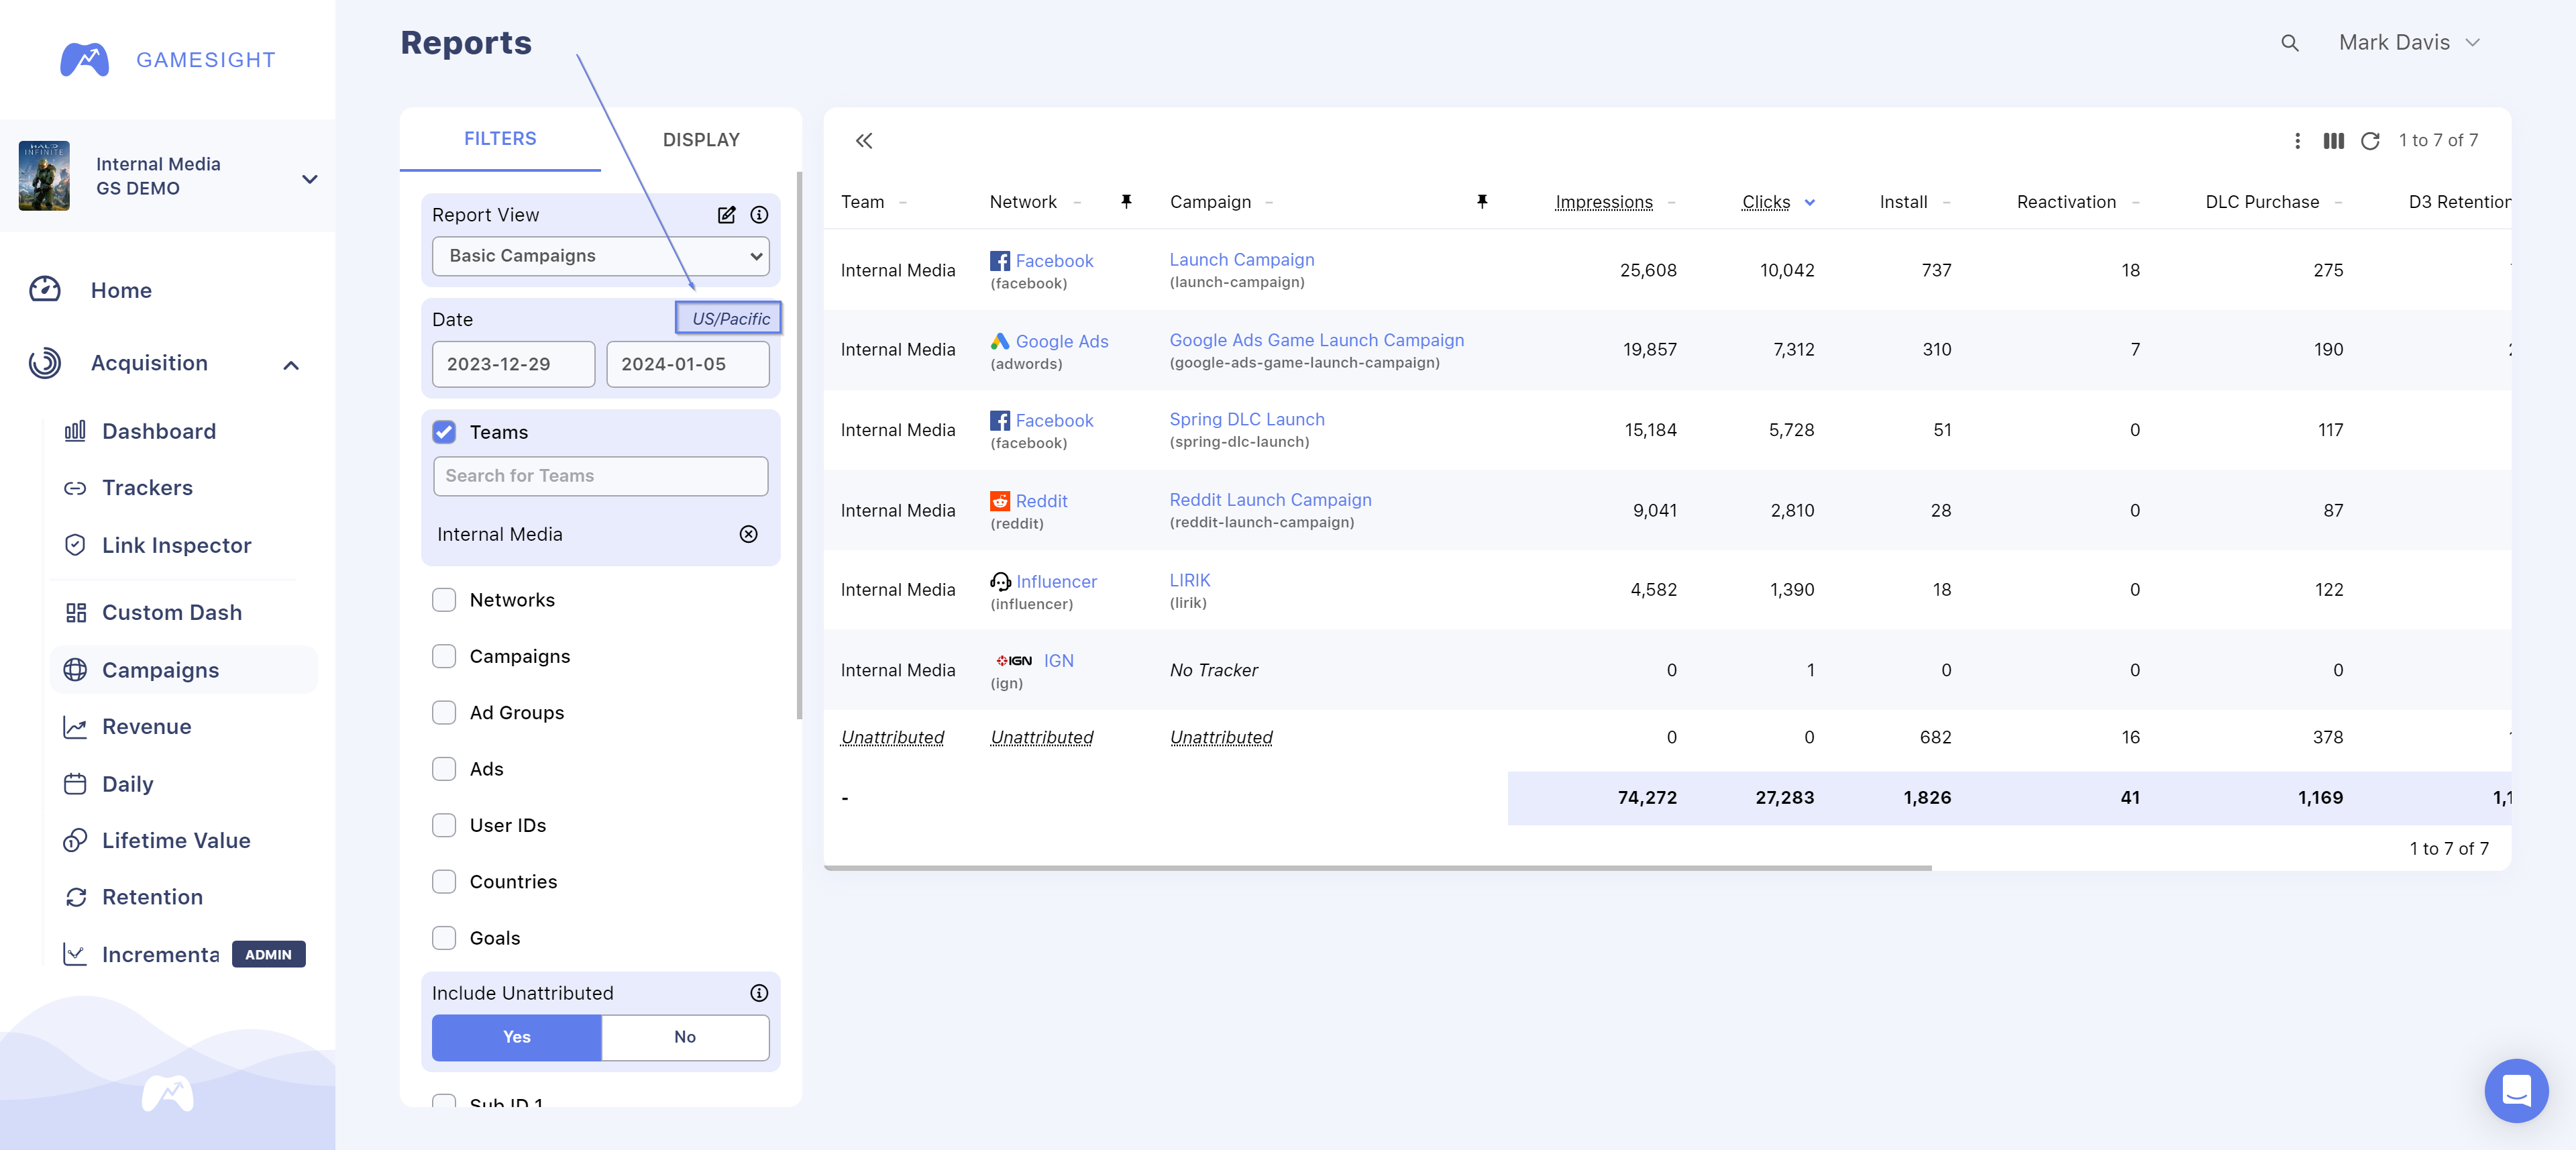
You will find an option to adjust the currency of your report under the Display tab as well.
Network Reported Metrics
In some cases, Gamesight may have multiple values available for the same metric. This is commonly the case for statistics such as Impressions, Clicks, and Spend where we have both the number of interactions recorded by Gamesight's ad tags and the reported value from the Ad Network.
In these cases, our reports will use the Reported value from the Ad Network over the value we measured directly. You can identify cases where we are performing this metric merging as they will always be displayed as an underlined value.

Example report with both Reported and Measured value
Hovering your mouse over the metric will display both values which can be helpful for identifying potential issues with your attribution tagging. In the image shown below, you can see that Gamesight recorded more clicks than Facebook reported. This discrepancy is normal because networks such as Facebook will filter/adjust clicks while Gamesight records every click.
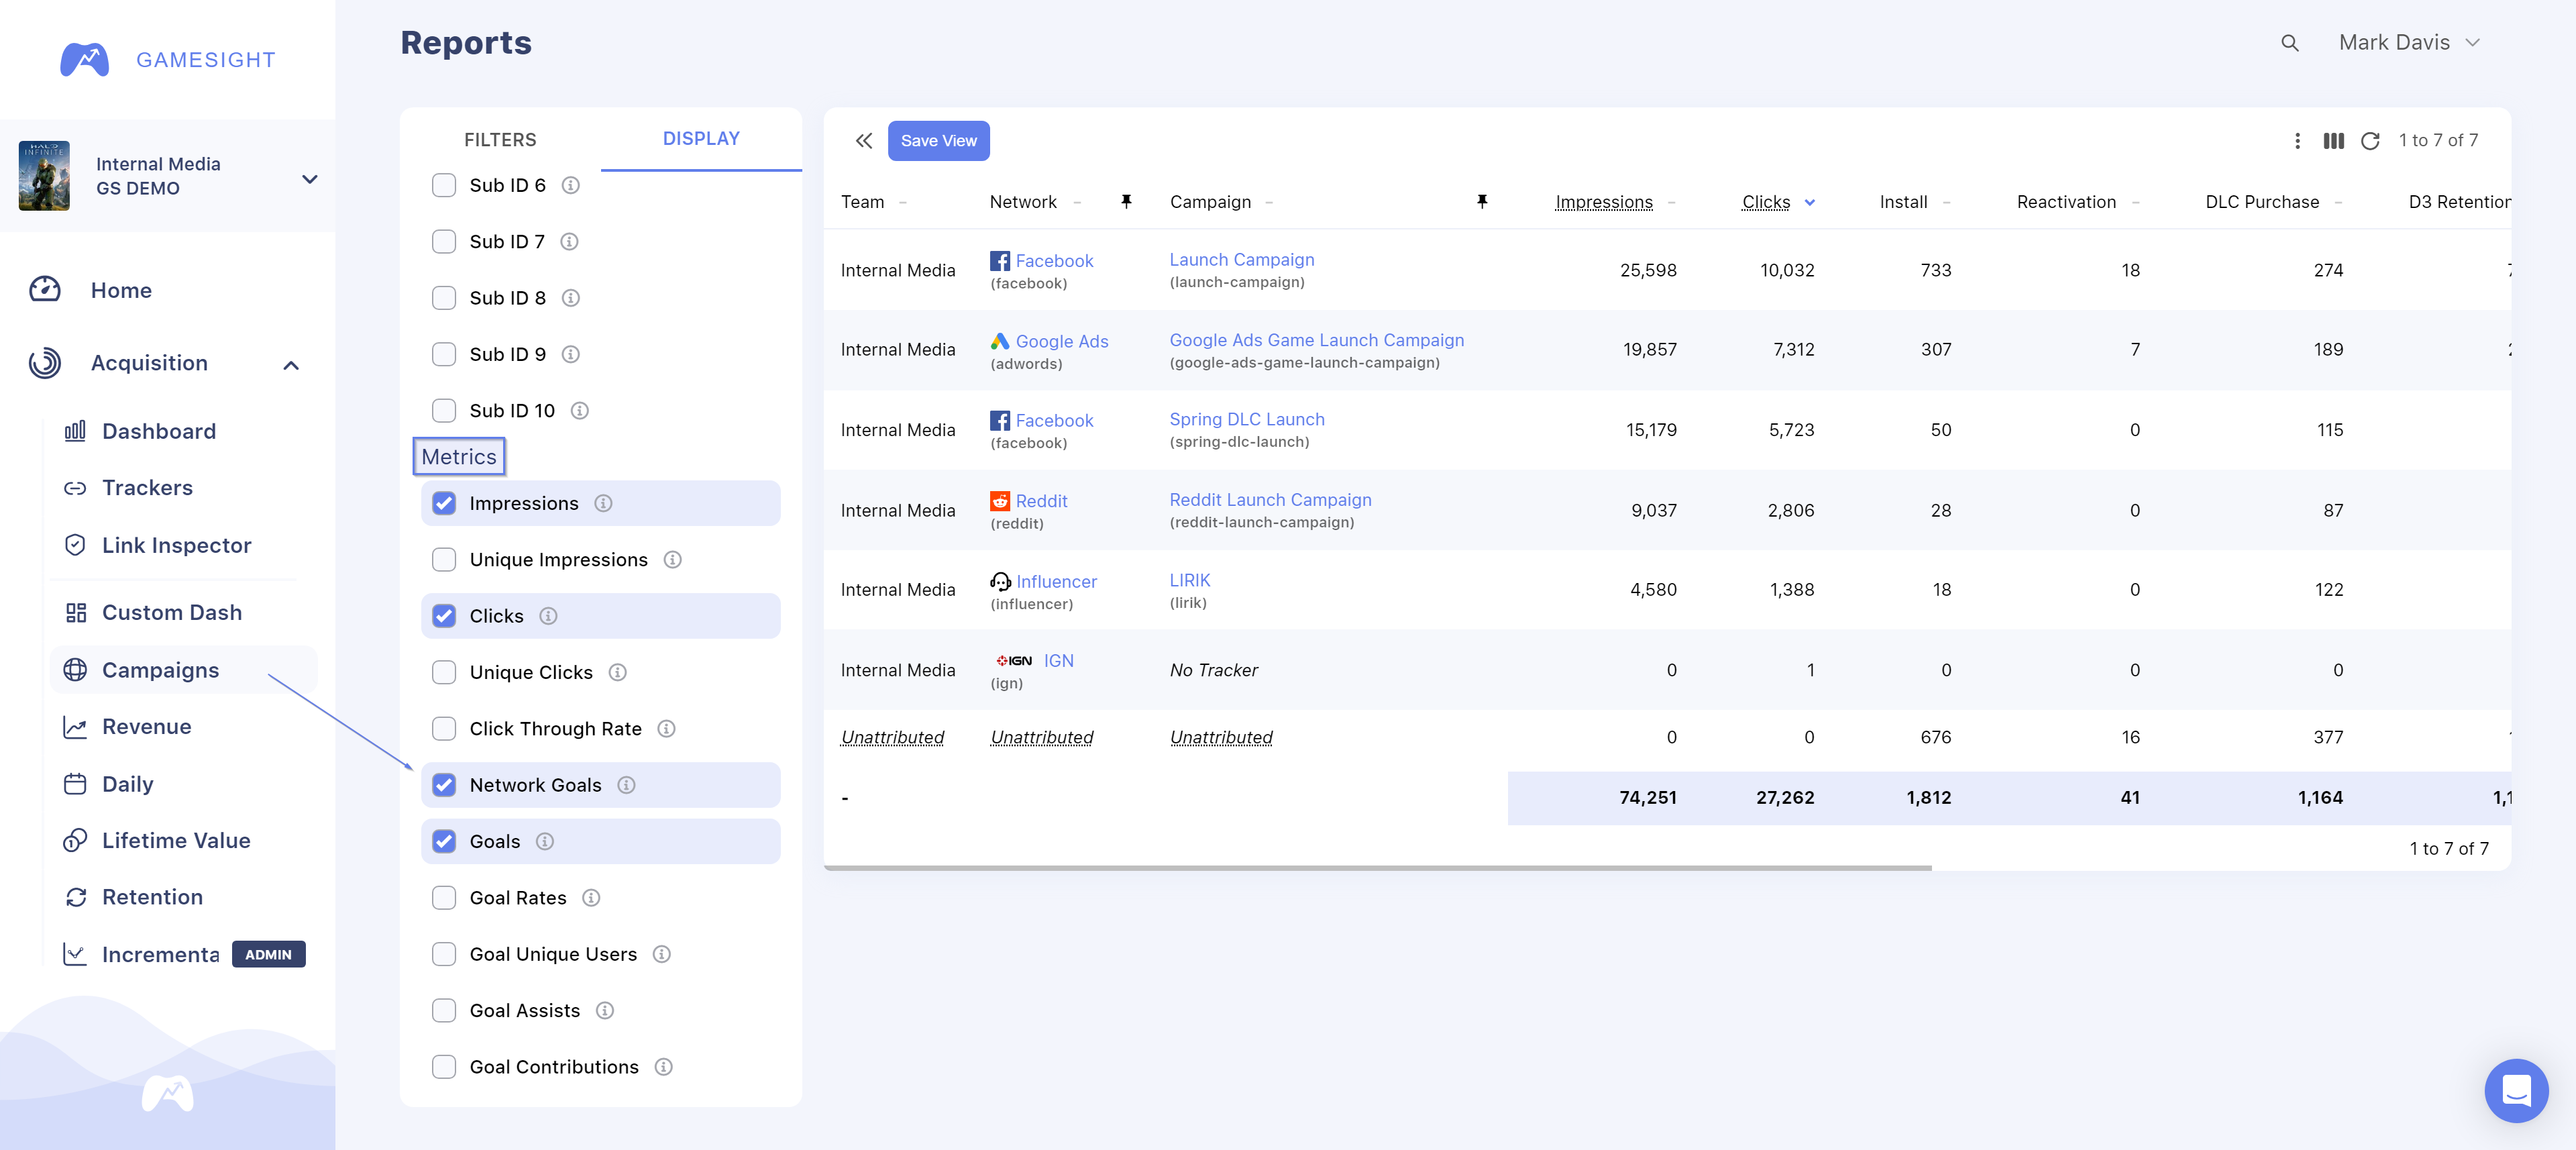
You can also add Network Goals (Goal data that is directly reported by the ad Network in aggregate) to your report by enabling the Network Goals metric on the Display tab of your Campaigns Report.
Multi-Touch Modeling
When running reports it is possible to customize the multi-touch attribution model which is used in reporting. By default, reports will use a last touch model for simplicity and to eliminate fractional credit. This can be customized using the "Modeled Goals" display option in reports.
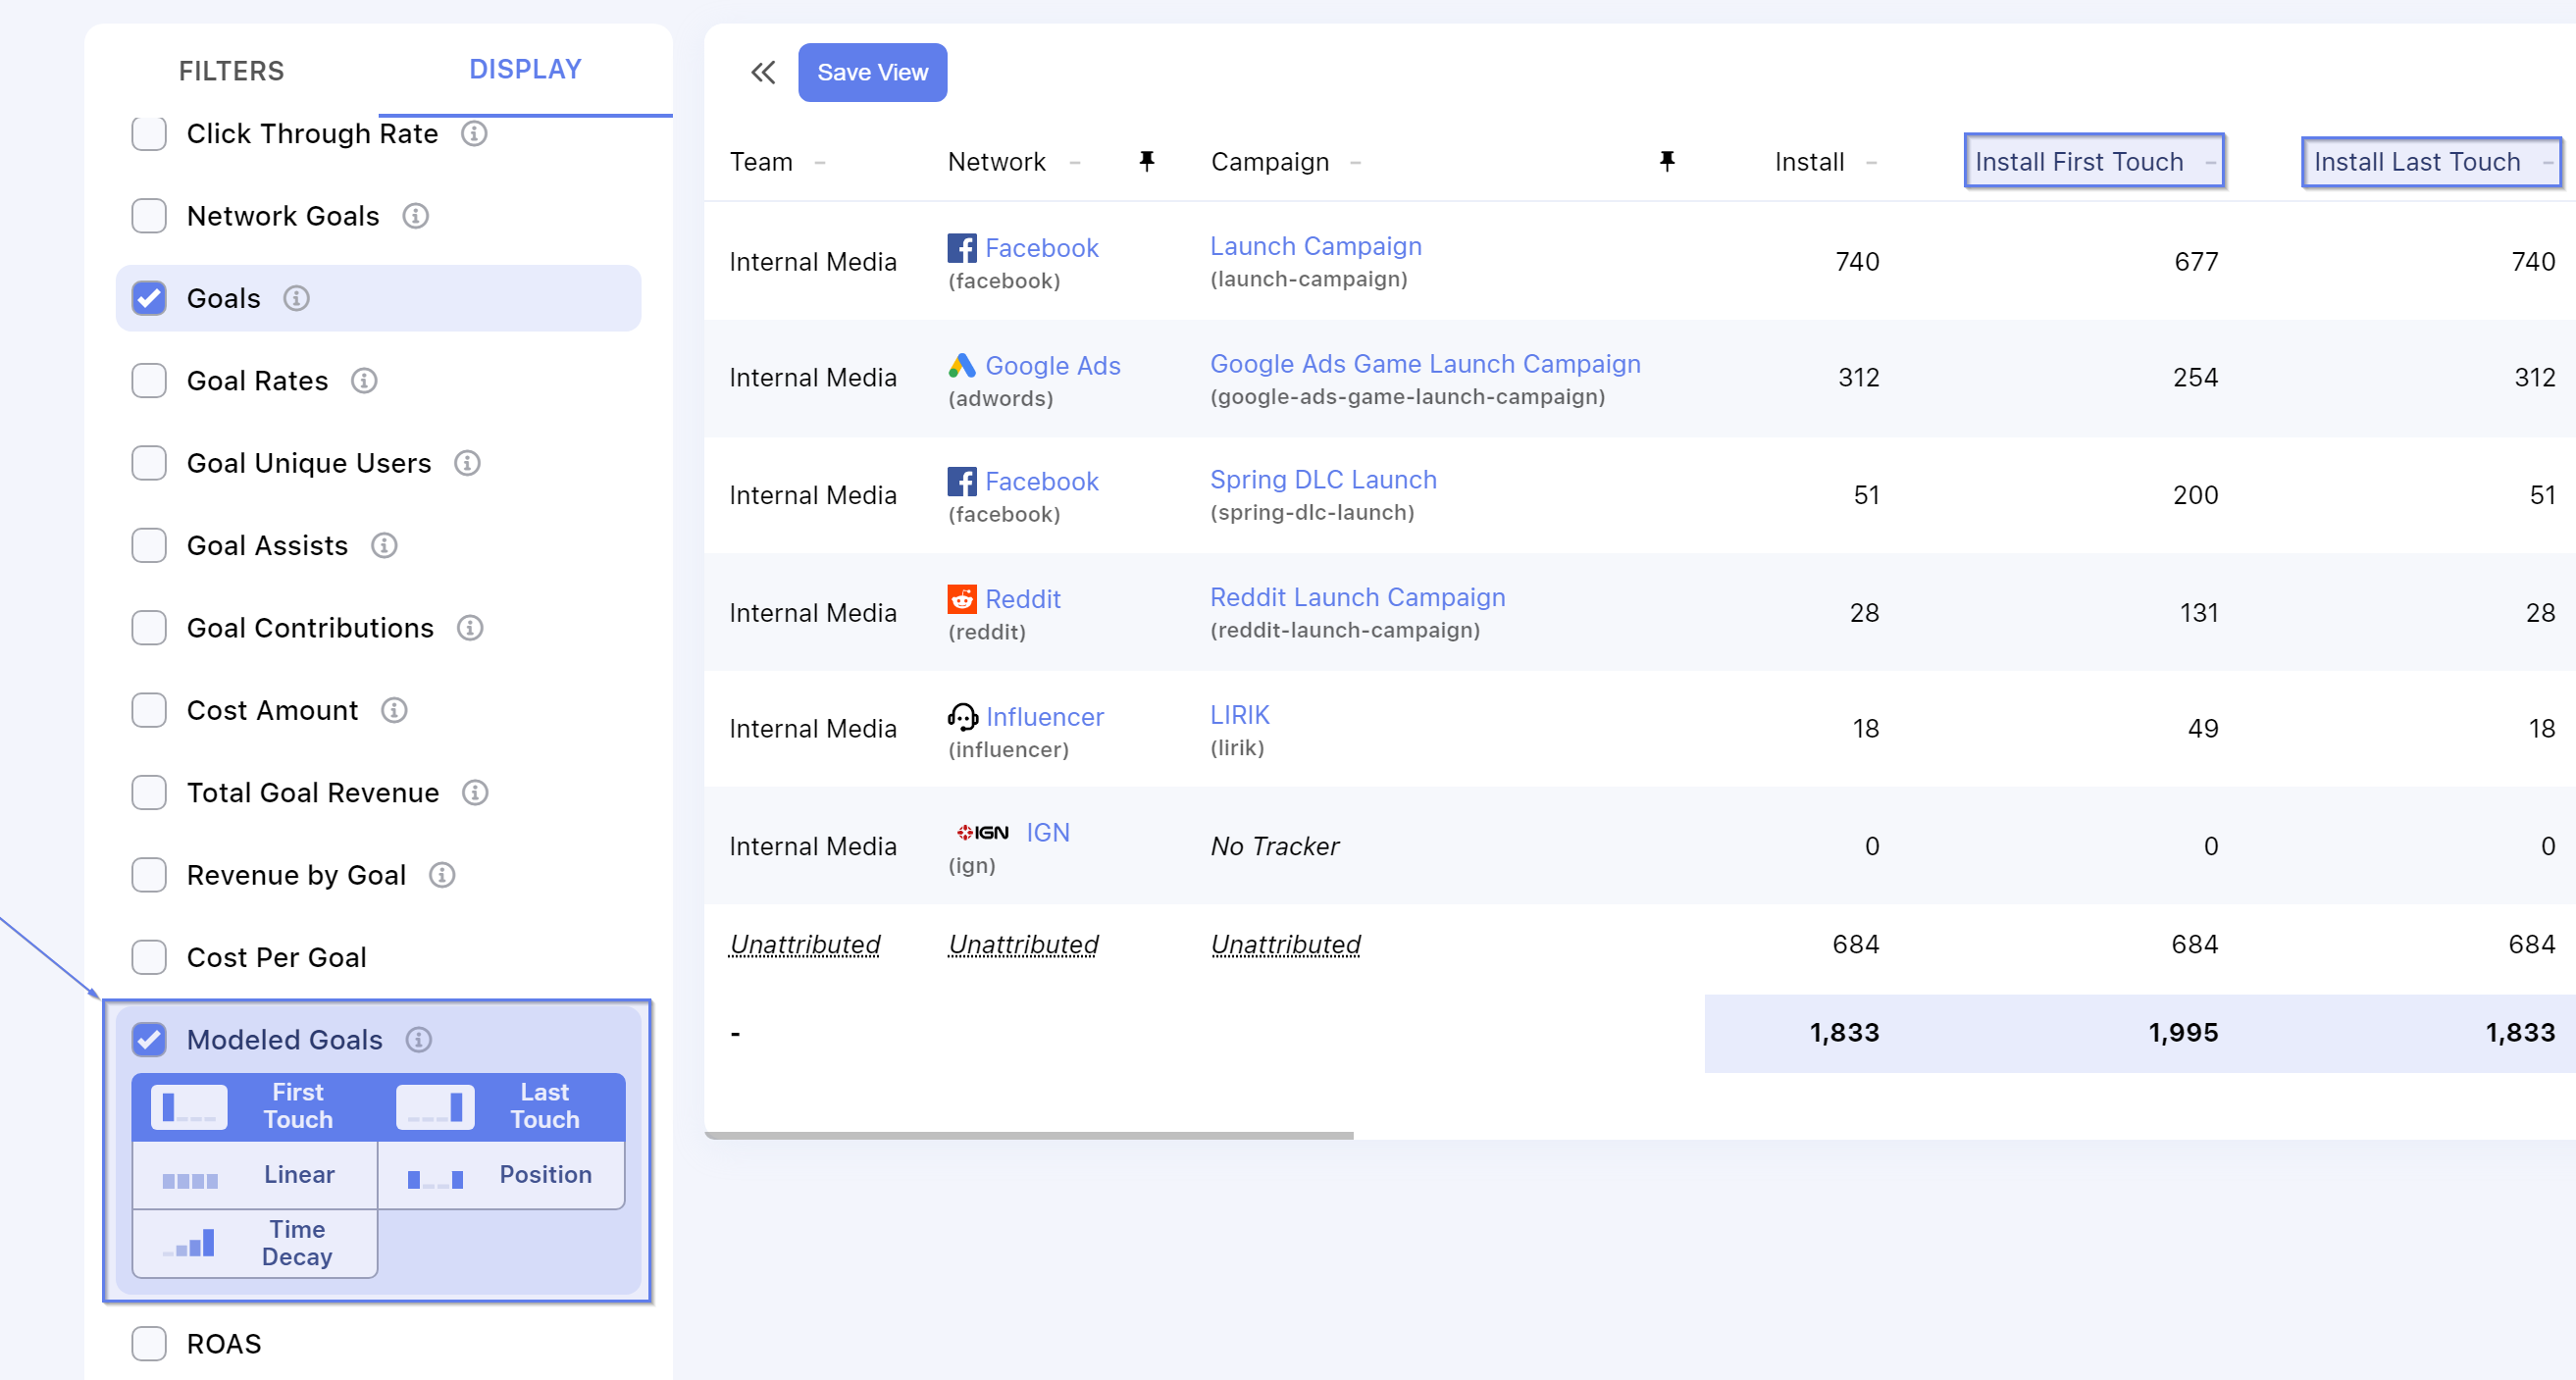
Example report with customized Multi-Touch model
You can read more about Multi-Touch Attribution and the available models on the Multi-Touch Attribution guide.
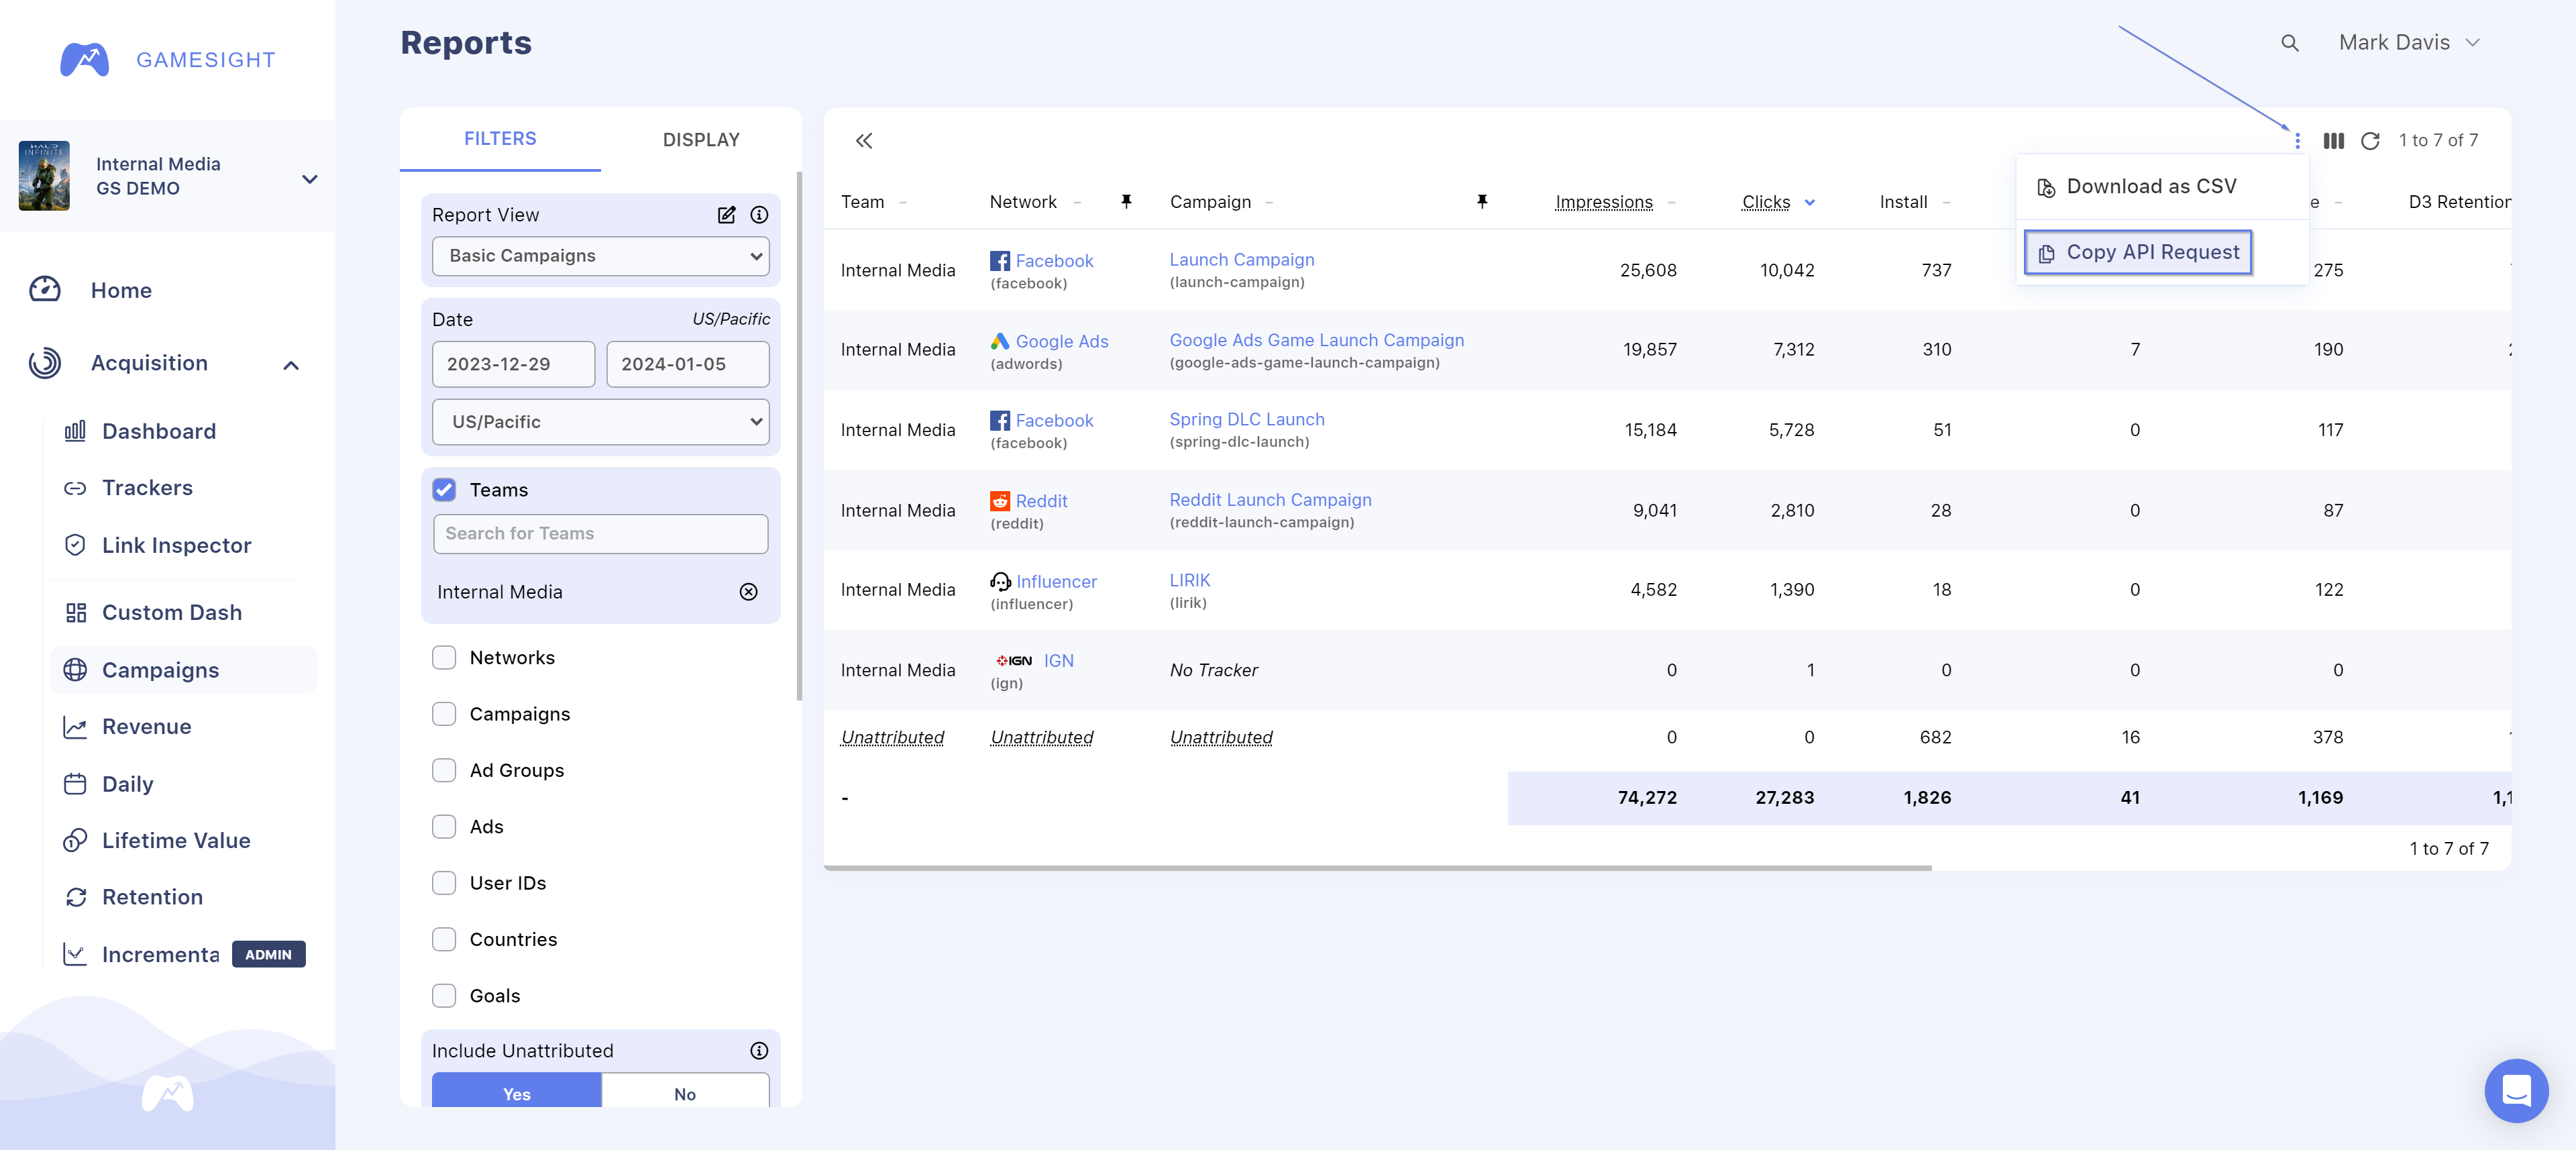
API Request Builder
Once you have a report set up in the Reporting UI, you can quickly and easily copy the API Request which can be used to pull the same report via the Reporting API. More details available in the API docs.
Troubleshooting
If the following solutions do not resolve your issue, please contact us through live chat on the bottom right of your screen or email us at [email protected] and we'll help you get to the bottom of it!
Issue | Solution |
|---|---|
Data discrepancy between Gamesight and Ad Network reporting? | 1. Double check that you are using the correct Gamesight tracking links in your placements. |
Updated 5 months ago
