Custom Dashboards
Custom Dashboards allow you to build a fully custom visualization of your reporting data. Create your own charts, tables, and more to serve as a source of truth for your team. Create a dashboard highlighting your latest marketing push or a analytics report for tracking trends in player behavior over time.
Pro+ Tier FeatureCustom dashboards are available to Pro and Enterprise tier creators. Please reach out to your account manager if you would like to discussing adding custom dashboards on your account
Creating Dashboards
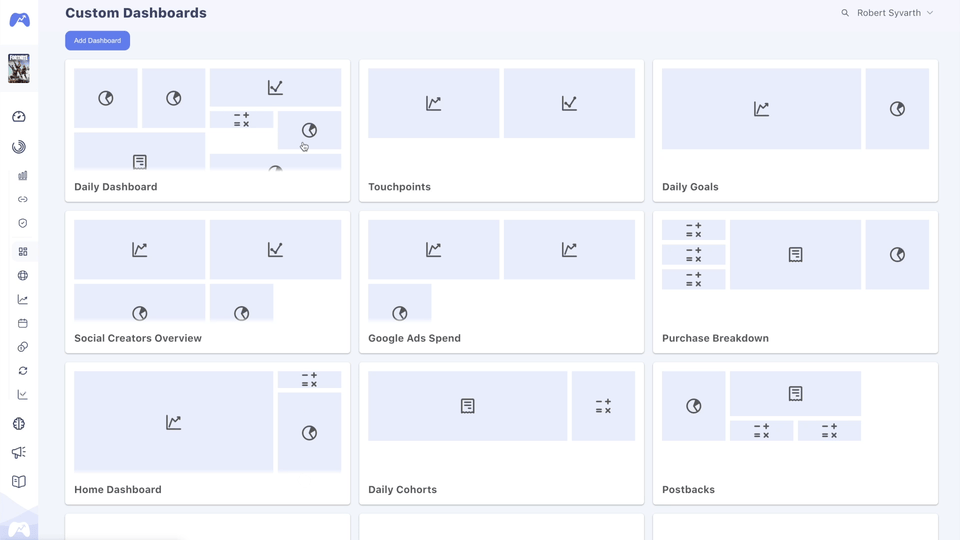
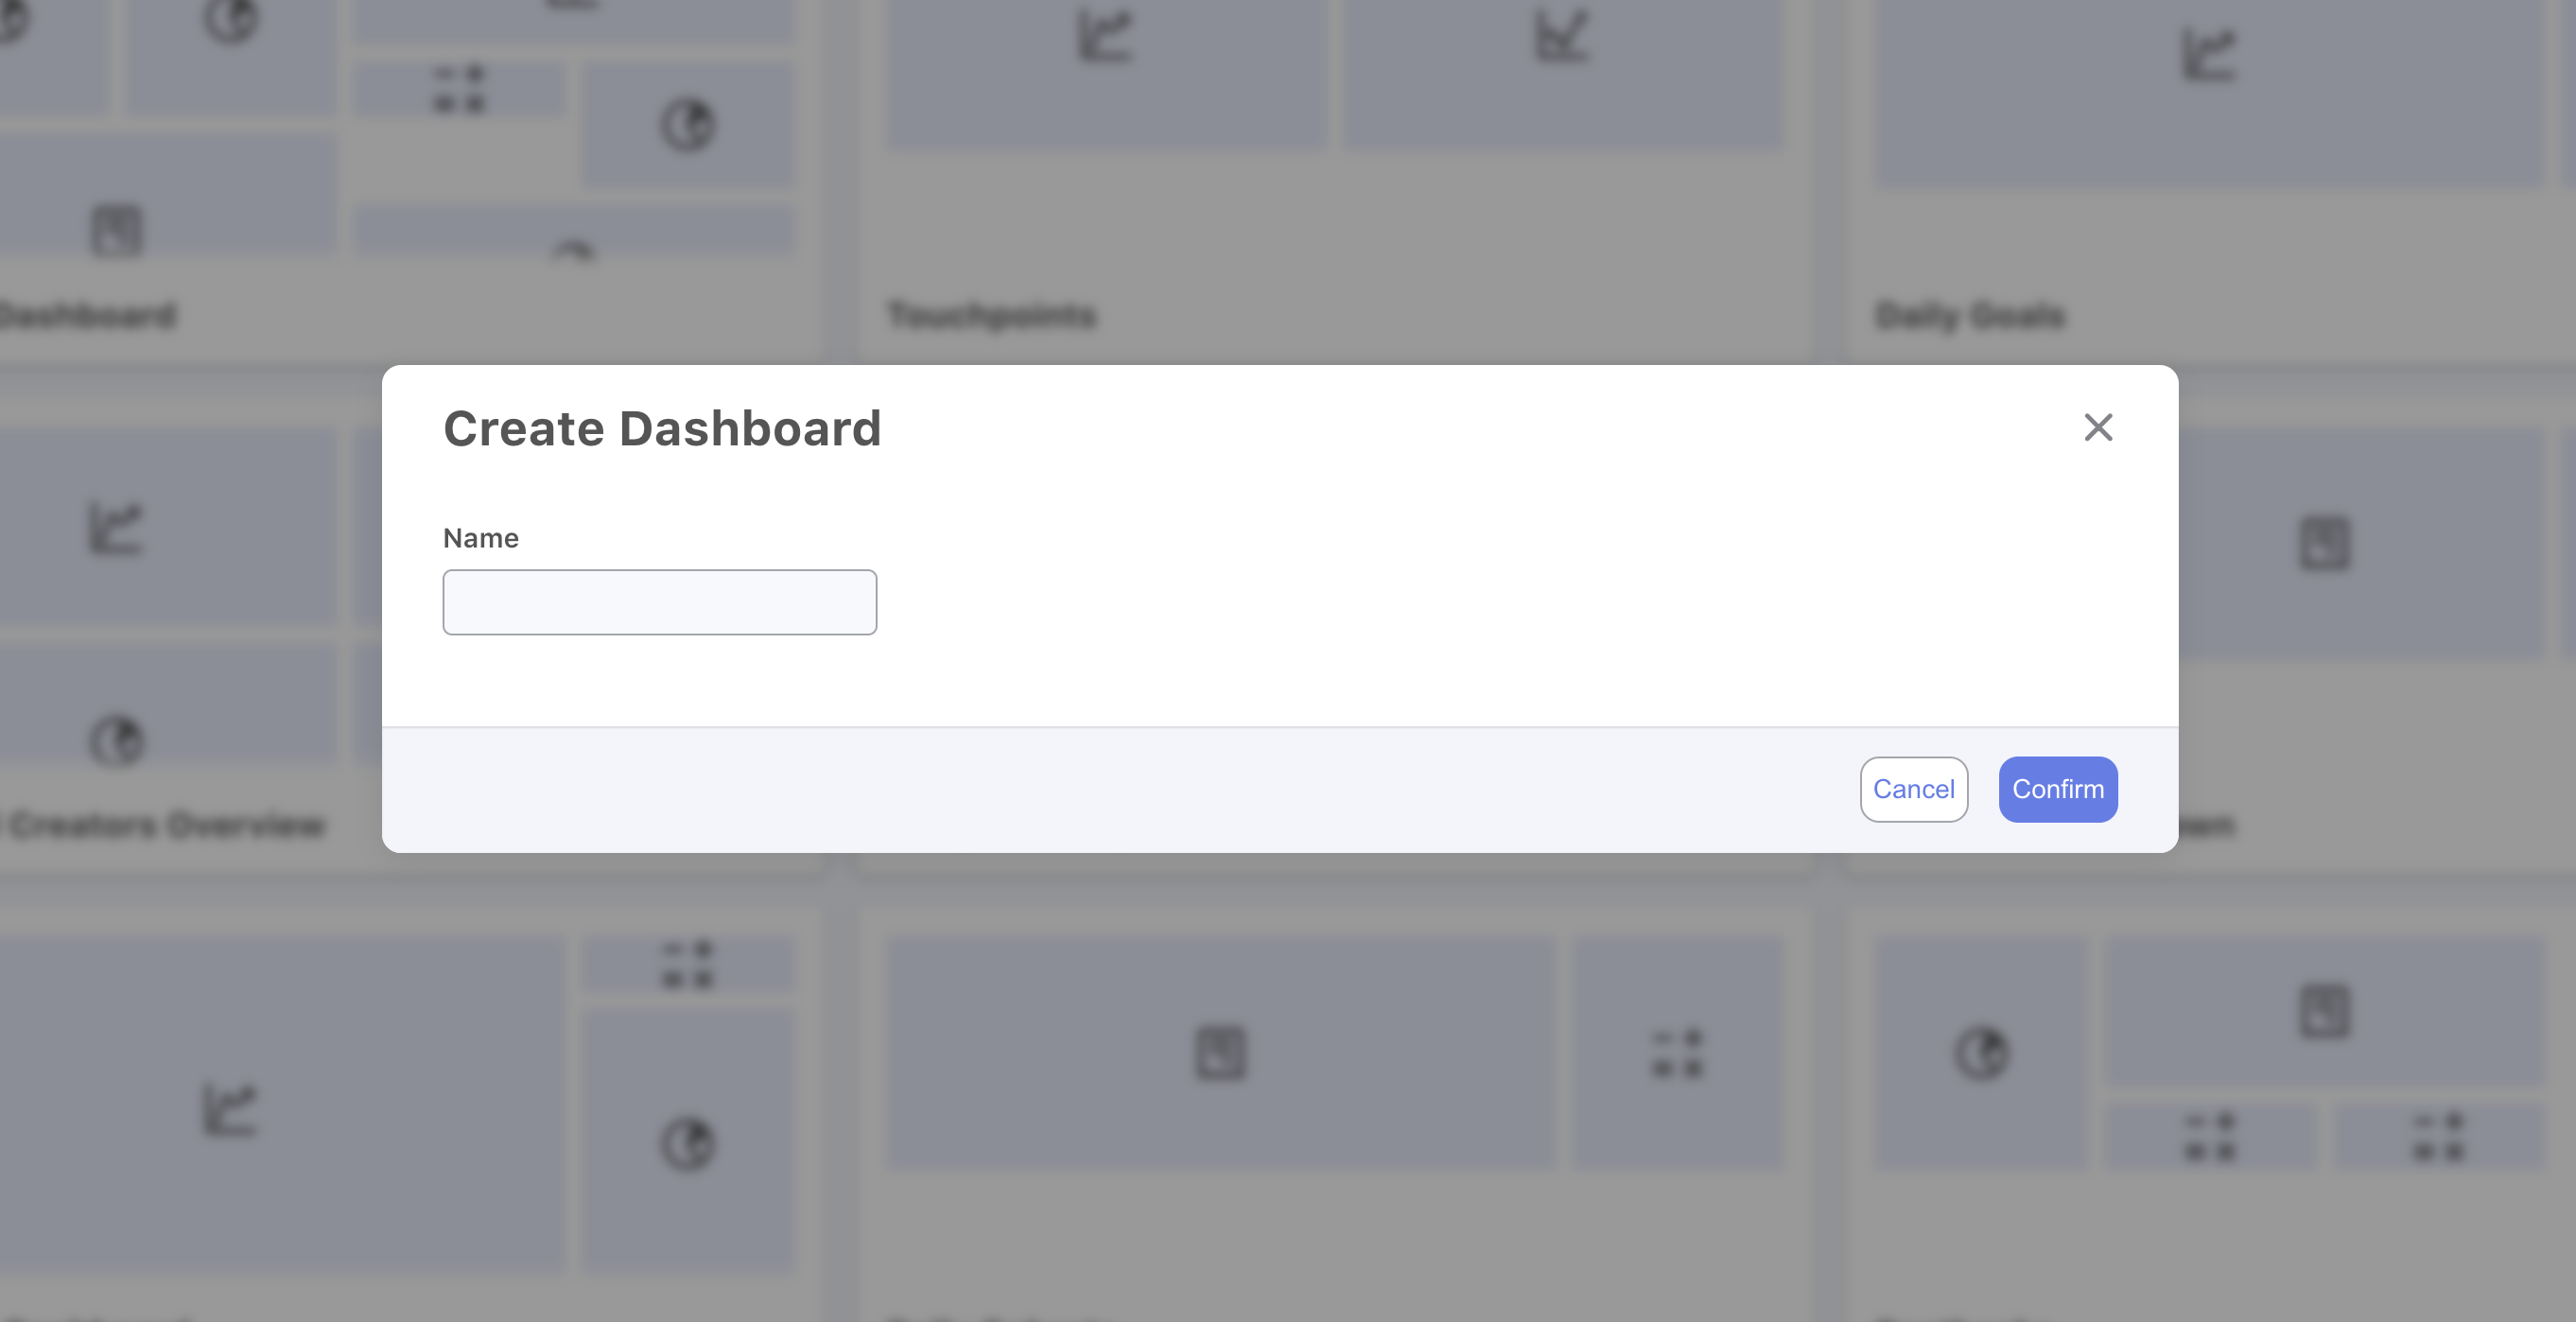
To get started with custom dashboards you can navigate to the "Custom Dash" page on the sidebar. From here you will be able to press "Add Dashboard" to create a new dashboard.
Once you have created a new dashboard it will become visible to all of the other members of your Team.
Building Visualizations from Reports
Create personalized views of your most important metrics by saving reports and charts directly to custom dashboards, giving your entire team instant access to critical performance data and trends.
You can easily save existing reports and visualizations to a dashboard directly from the Report Table.
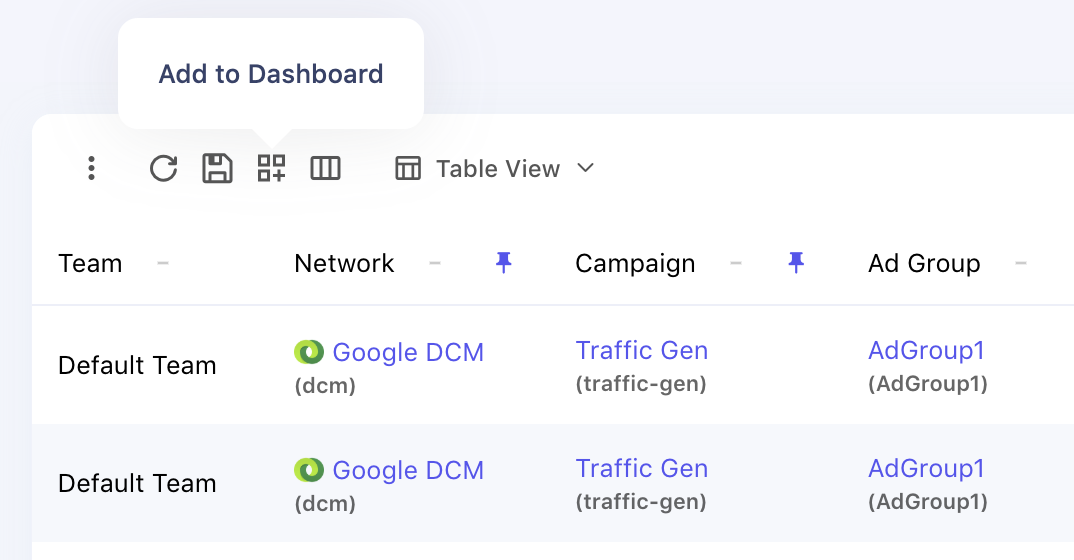
Add to dashboard button to save report to dashboard
This will open a modal where you can select the dashboard you'd like to save your report to.
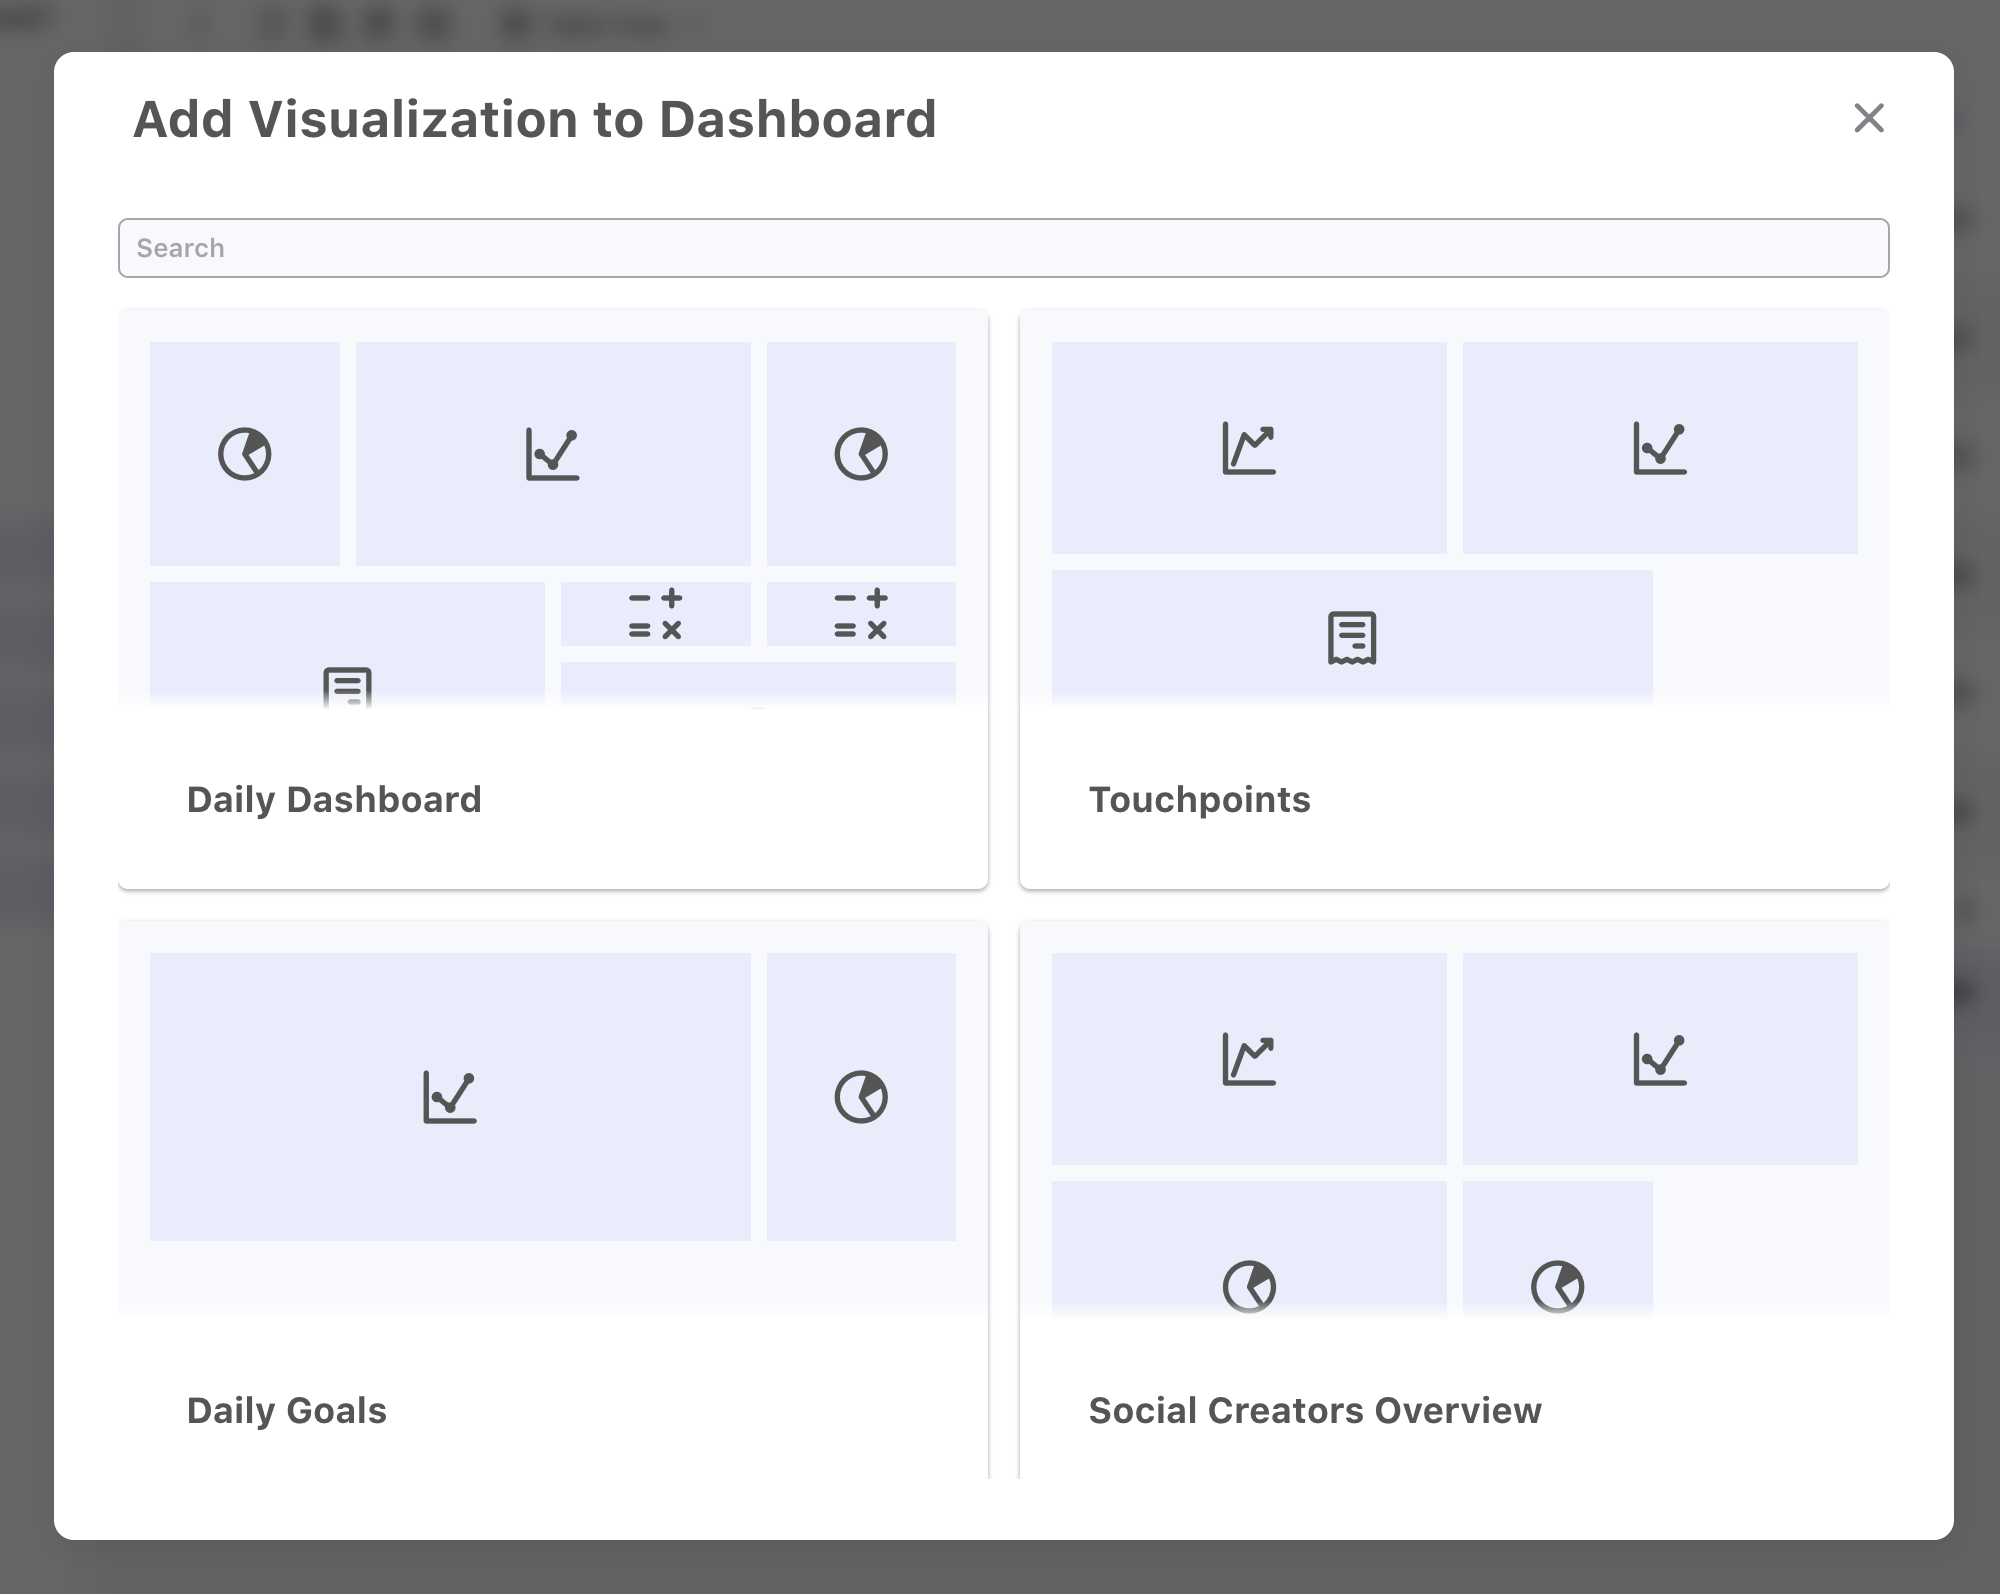
Dashboard selection modal
After selecting the dashboard your report will be added directly to your target dashboard. This can include Table, Line Chart, Pie Chart, and Single Number blocks.
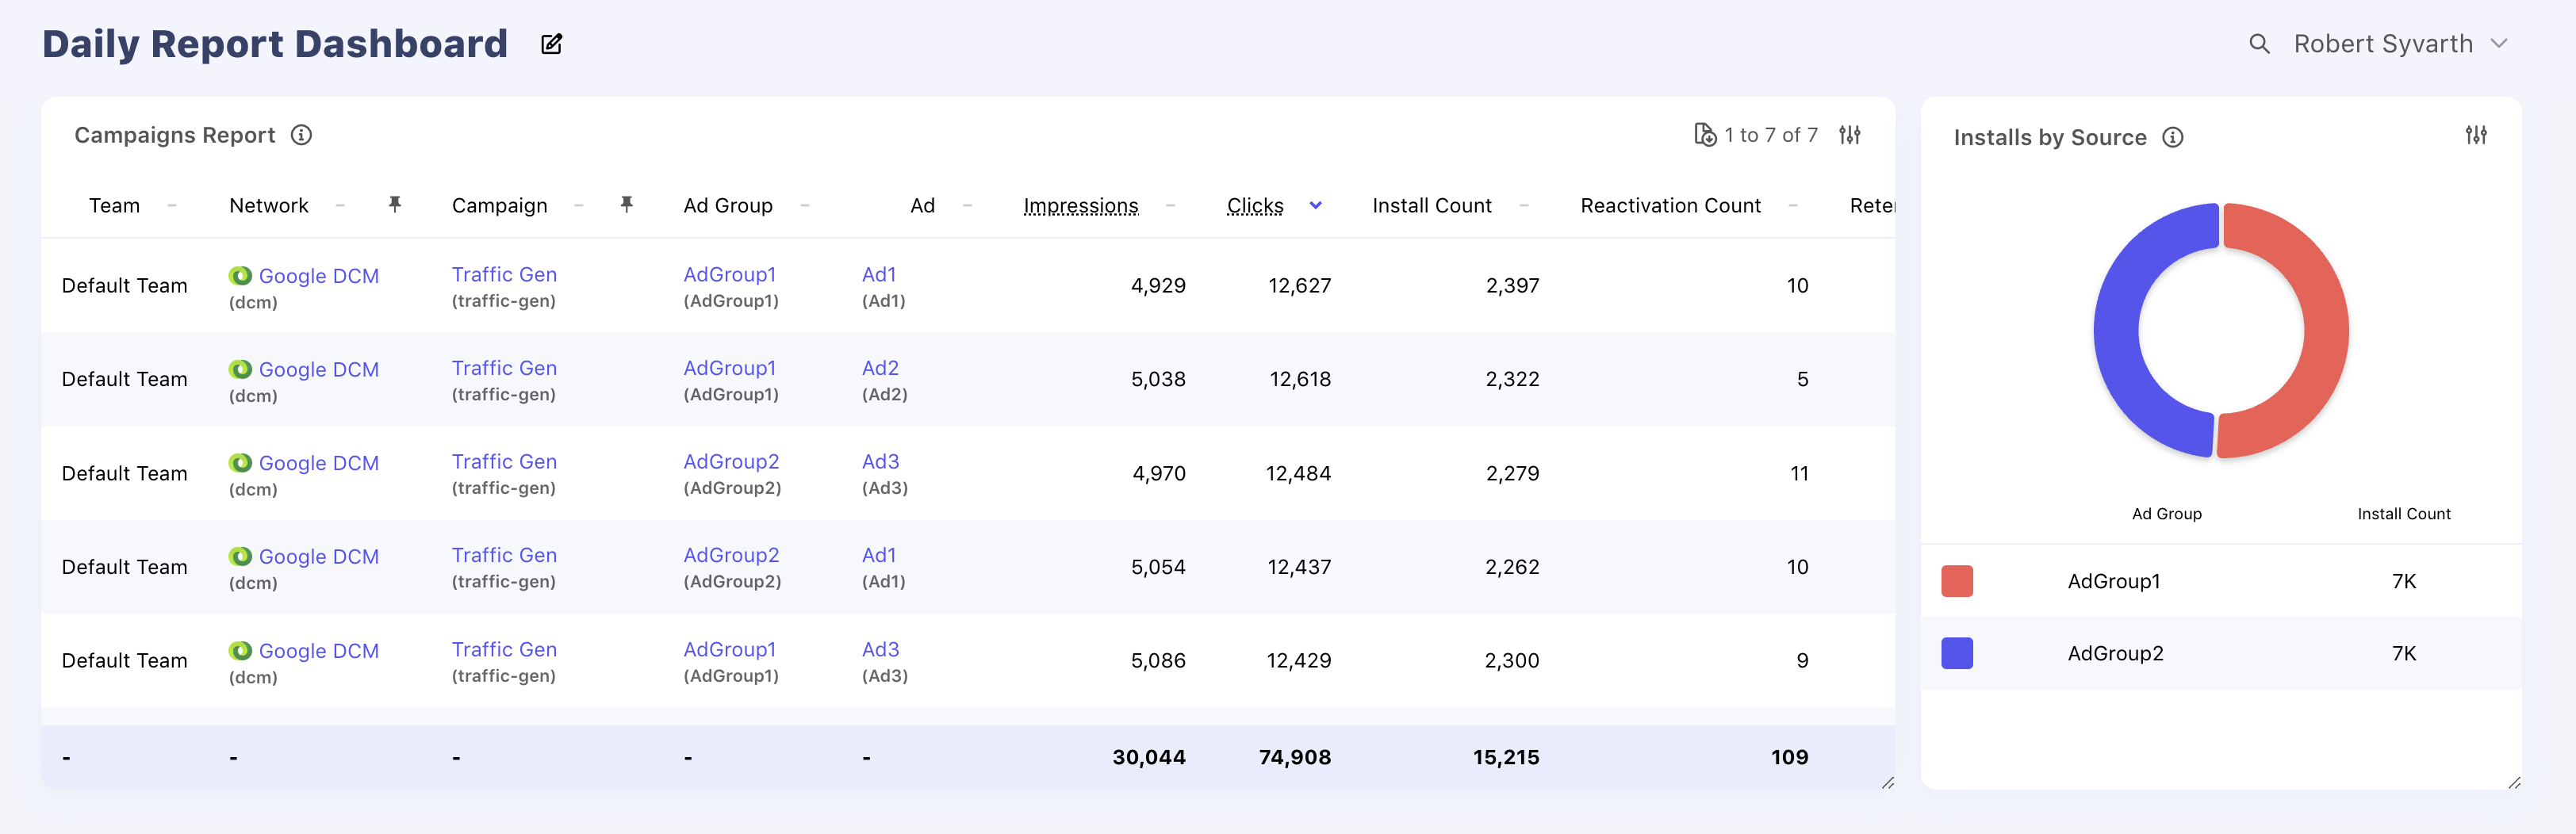
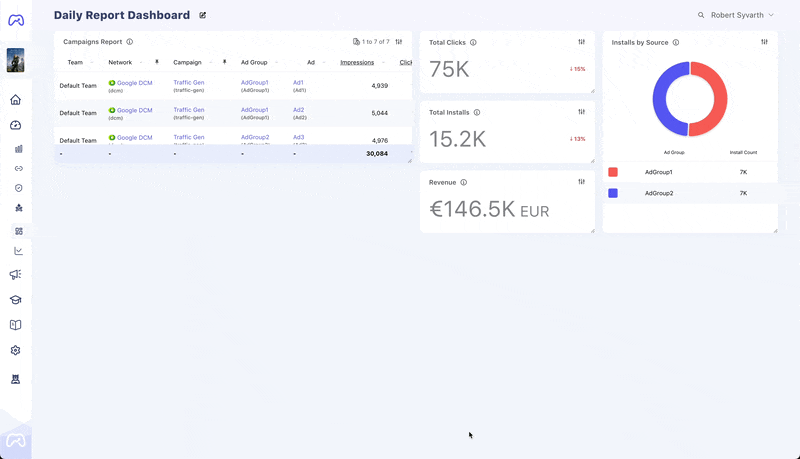
Example Custom Dashboard with Reports included
Building Custom Visualizations
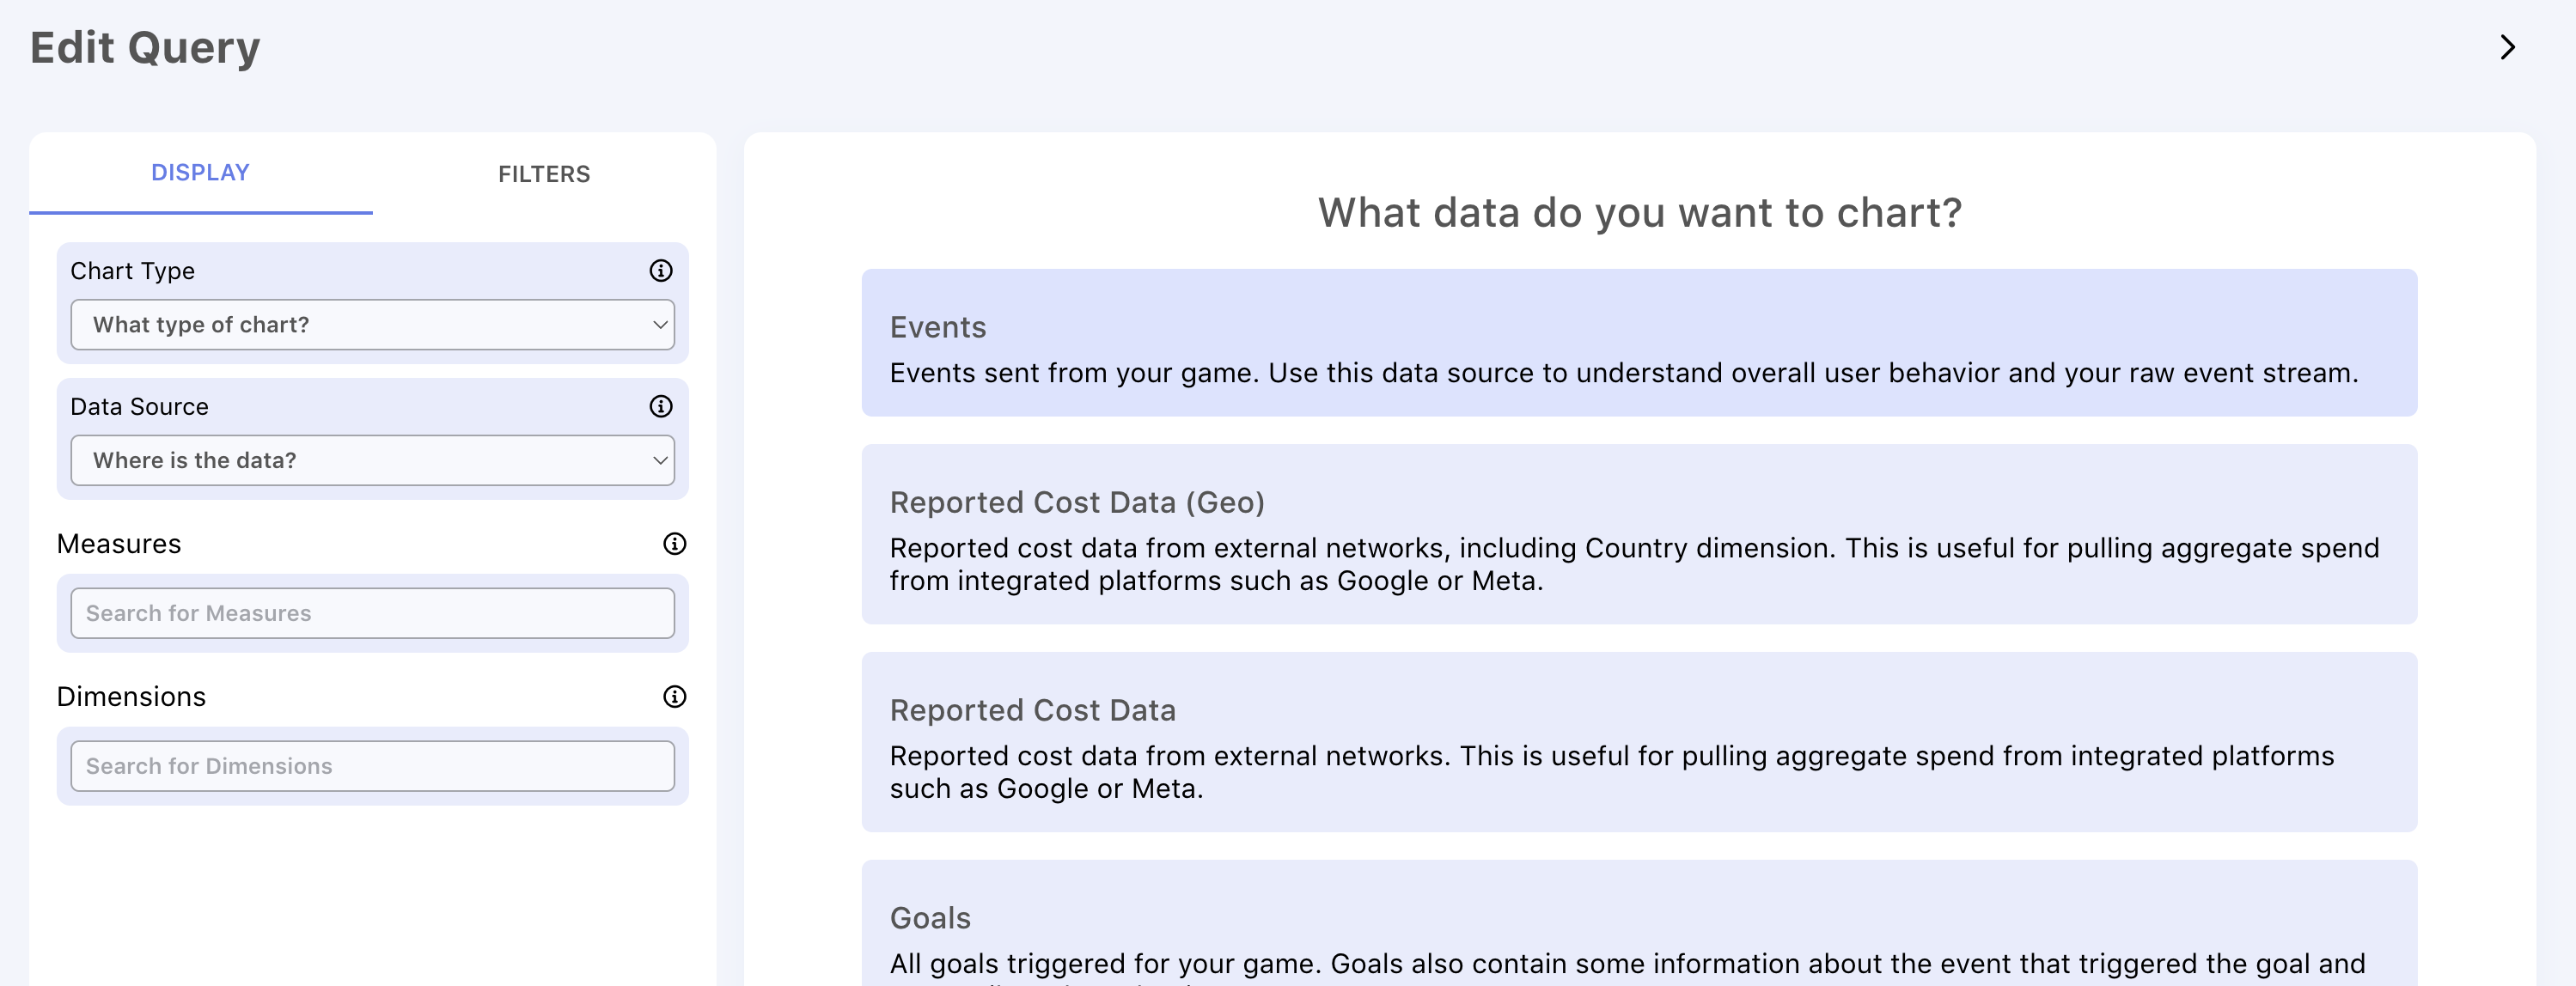
If you have more advanced dashboarding use cases, it is also possible to build custom visualizations directly from your Event, Goal, and Touchpoint data be selecting the relevant data sources when adding a new visualization.
From the dashboard page you can begin adding Blocks to your dashboard. These blocks are the primarily components of your dashboard and can be resized and moved to suit your needs. To begin you will select the type of visual you intend to create
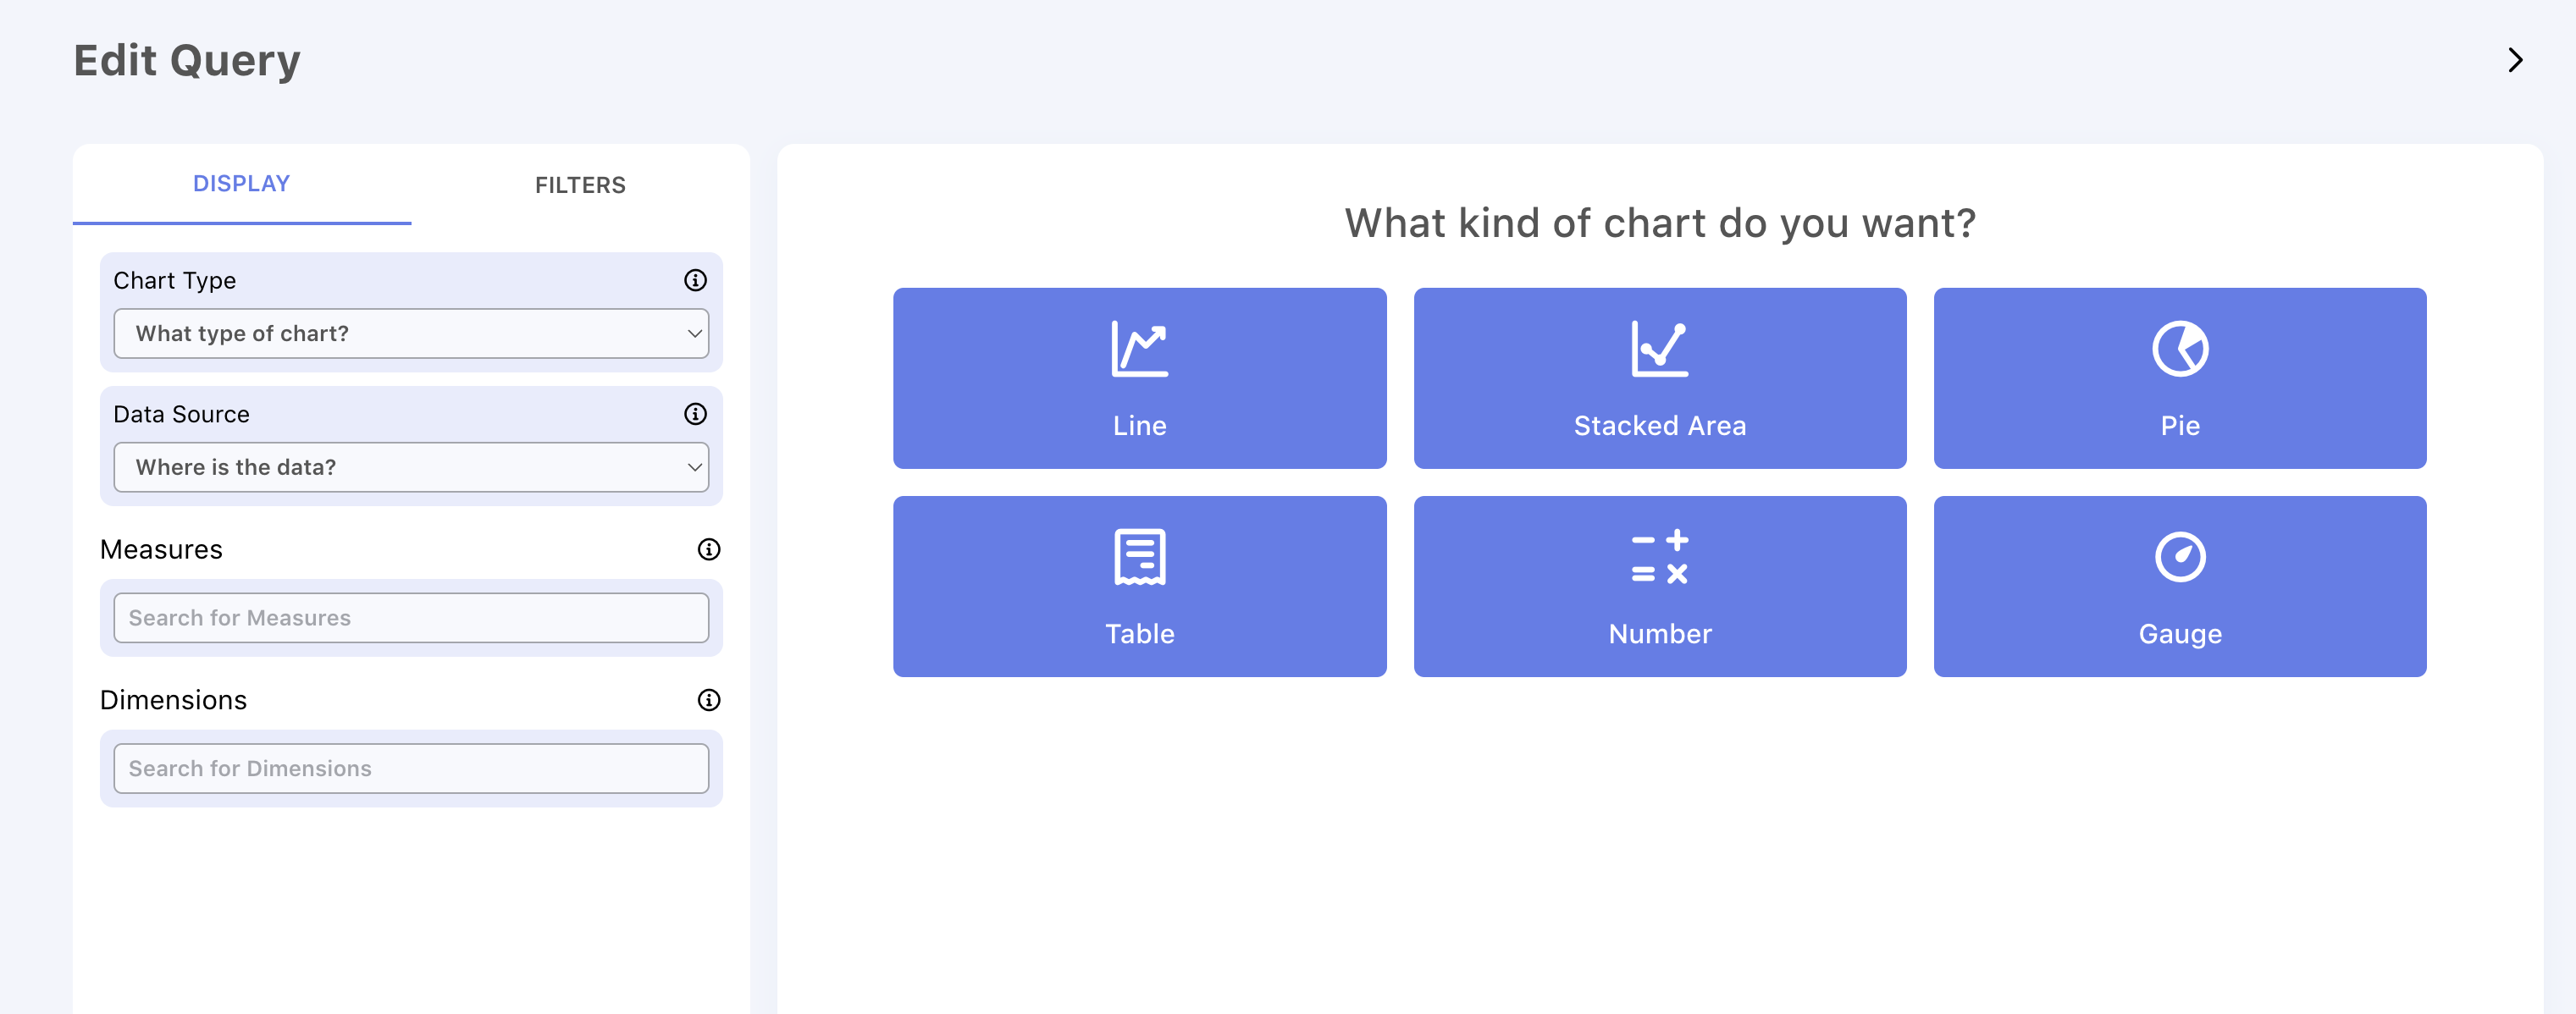
Next, select the data source you wish to use for your visual.
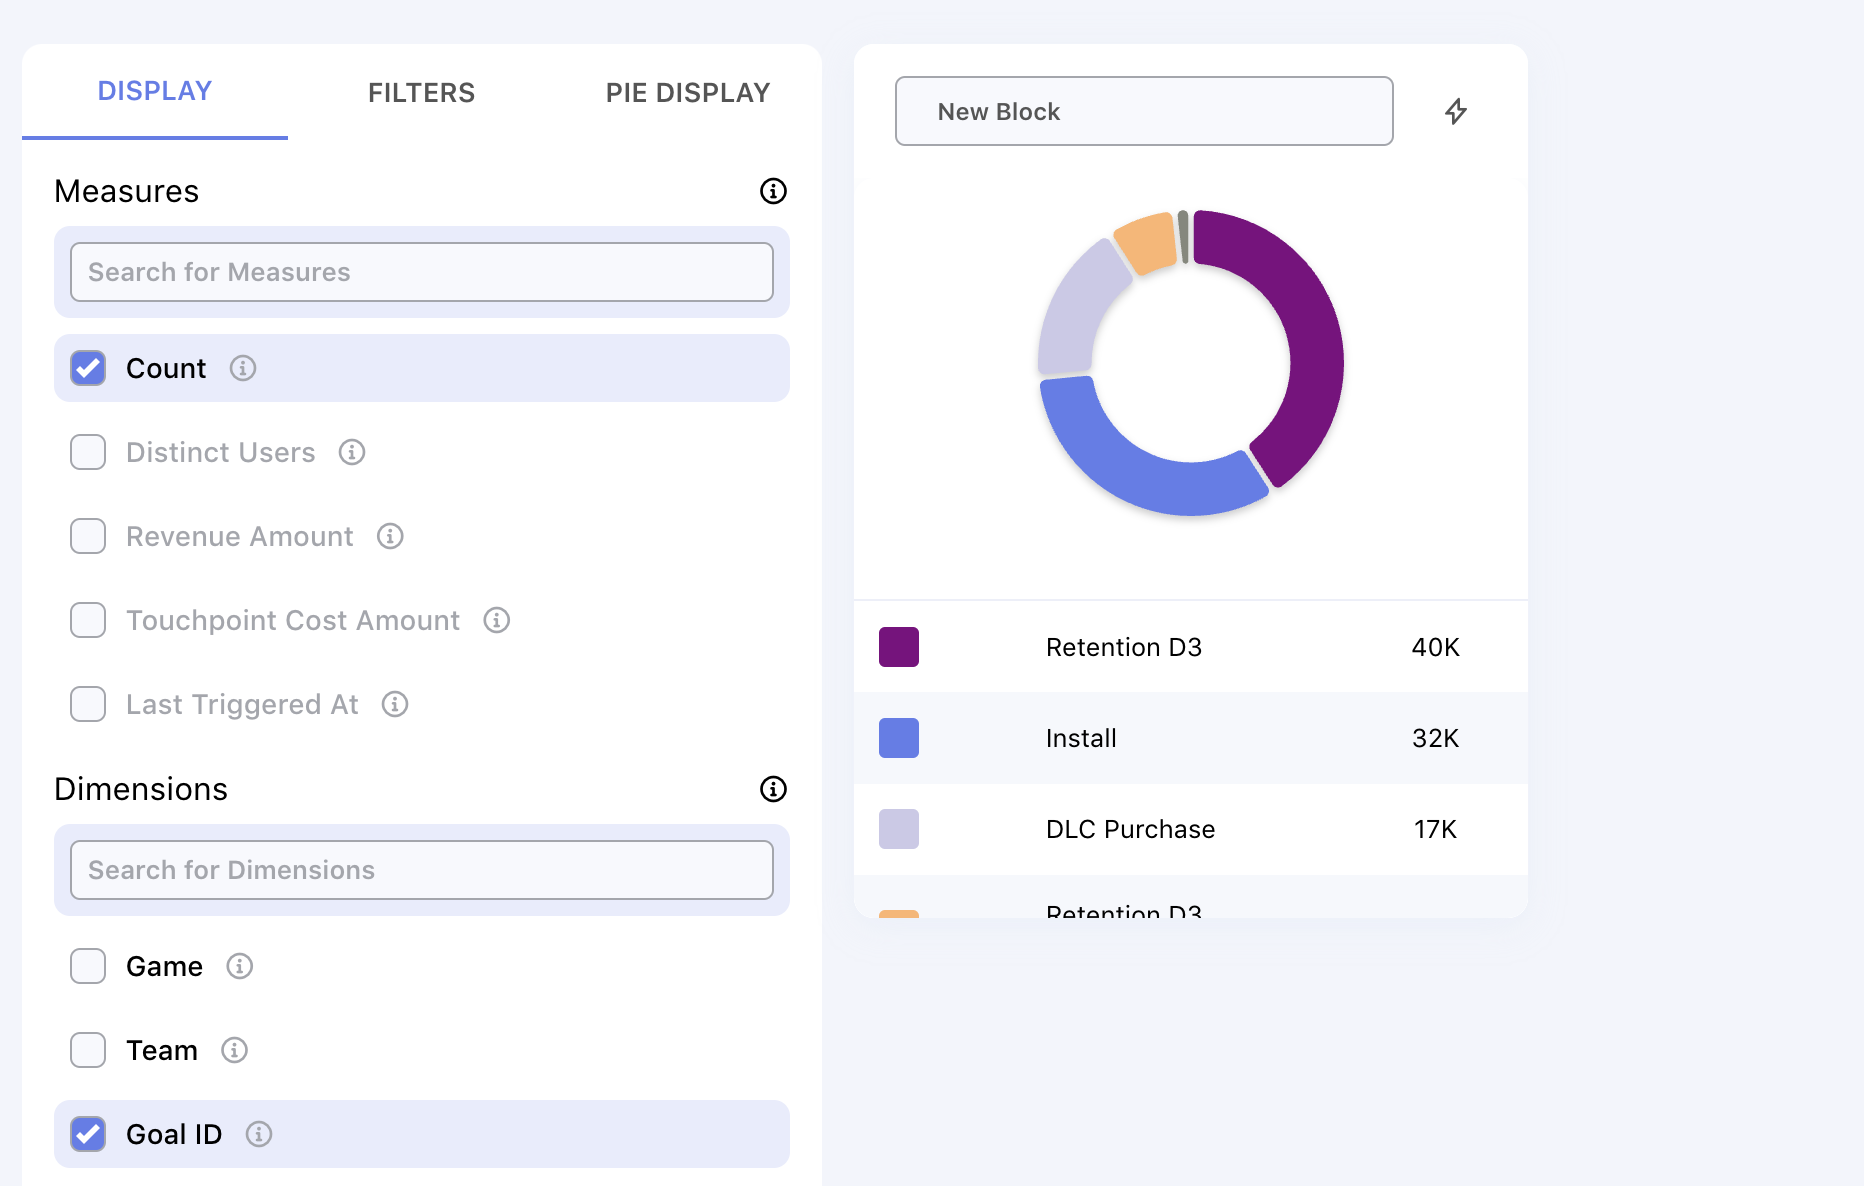
Then you can modify the data for your dashboard by specifying the Measures, Dimensions, and Filters:
- Measures - the values which you want to chart, often this is a count or sum of values.
- Dimensions - the fields to group the report by. Dimensions are optional. Use them for comparisons or to add more context, often values like Network or Goal Type.
- Filters - used to control which data is included in the report. This tab contains controls for the time range of the report as well as ability to filter down to specific slices of data (eg single Country or Goal type)
Once you are happy with your visualization you can save the block and it will be added to your dashboard. From here continue to add new blocks, drag and drop to move them, and resize as you would like!
Managing Visualizations
Once you have created a visualization you can make further adjustments using the visualization setting button. From this panel you can make changes to the Display, Filter, and Chart Settings for the visualization.
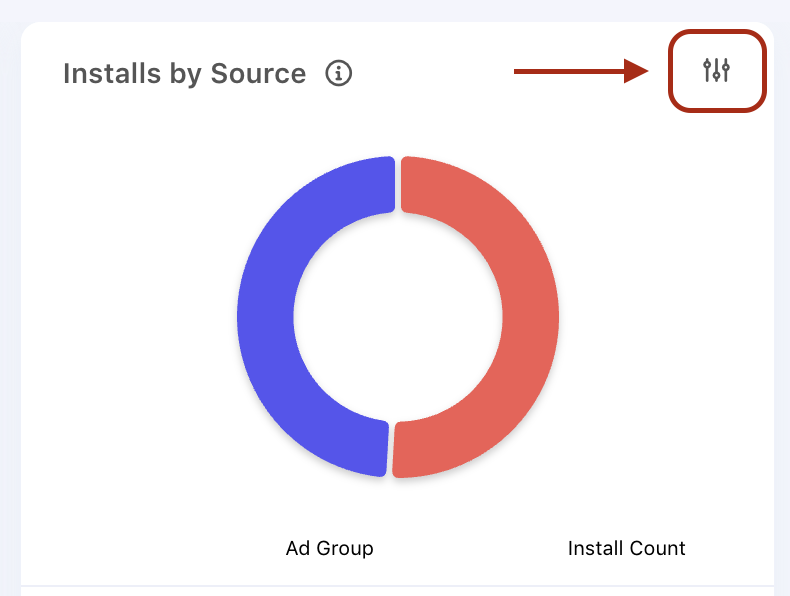
Visualization settings button
Size & Placement
Creating your ideal dashboard layout is easy with simple drag and drop controls for managing your dashboards.
- Resize your visualizations by dragging on the handle in the bottom righthand corder of the visualization
- Adjust layout with drag and drop block placement
You can see a demo of this functionality below in the embedded animation
Drag and drop dashboard layouts
Dashboard Time Range Controls
Dashboard Time Range Controls feature allows you to set default time ranges on attribution dashboards to streamline your reporting workflow.
Setting Default Time Ranges
You can configure default time ranges for any dashboard in Gamesight:
- Navigate to the dashboard you want to configure
- Click on the "Settings" gear icon next to the Dashboard name
- Choose your preferred time range option
- Click "Save" to apply your changes
Updated 10 months ago